The Construct Validity of the Russian Version of the Modified Academic Self-Regulation Questionnaire (SRQ-A) among Elementary and Middle School Children
Abstract
Background. The Academic Self-Regulation Questionnaire (SRQ-A) is a useful self-report measure of academic motivation grounded in self-determination theory (E. Deci, R. Ryan).
Objective. The aim of the present study was to evaluate the utility of the Russian version of the SRQ-A by reporting psychometric properties, examining the factorial structure of the SRQ-A, and assessing its construct validity in a large sample of primary and middle school children.
Design. To validate the Russian version of the SRQ-A, two cross-sectional studies were conducted, one with primary schoolchildren, and the second with middle schoolchildren.
Results. We developed and tested the Russian version of the SRQ-A on a sample of 1215 children, Grades 3-7, from three primary and three secondary (middle) schools in Russia. The multidimensional factorial structure of the original measure was tested with bifactor exploratory structural equation modeling (B-ESEM) and confirmatory factor analysis (CFA). Construct validity was tested using correlational analyses with convergent and divergent measures. The SRQ-A showed good internal consistency for all subscales, with Cronbach’sαranging between 0.65 and 0.77 for the primary school children (Study 1), and 0.74 and 0.82 in a sample from the middle school children (Study 2). In both studies a simplex-structure pattern was confirmed, and the CFA model, with seven first-order factors and two second-order factors for intrinsic regulation and extrinsic regulation, had an acceptable fit. The results of both studies demonstrate that the subscales show good convergent and discriminant validity with respect to basic psychological needs, attitudes toward school, school well-being, and general well-being scales.
Conclusion. In sum, the 26-item Russian SRQ-A is a reliable and valid self-report instrument for the assessment of self-determined types of motivation for primary and middle schoolchildren.
Received: 11.04.2020
Accepted: 03.06.2020
Themes: Educational psychology
PDF: http://psychologyinrussia.com/volumes/pdf/2020_3/Psychology_3_2020_113-131_Gordeeva.pdf
Pages: 113-131
DOI: 10.11621/pir.2020.0308
Keywords: motivation; questionnaire; validation; self-determination theory (SDT); children (8-14); academic motivation; measurement; Academic Self-Regulation Questionnaire (SRQ-A)
Introduction
Motivation refers to the reasons that underlie behavior. Self-Determination Theory (SDT) is one of the most influential contemporary theories of human motivation and has an impressive amount of empirical support (Ryan & Deci, 2017). According to SDT, motivation differs not only in quantity, but also in quality, where quality refers to the individual’s relative degree of autonomy or self-determination (Ryan & Deci, 2000). To reflect this, SDT distinguishes between extrinsic motivation, which is based on some contingency separable from the behavior itself, and intrinsic motivation, which is based on the satisfaction inherent in the behavior itself.
Furthermore, SDT measures extrinsic motivation along a continuum reflecting degrees of self-determination, which are traditionally marked as external, introjected, identified, and integrated (Ryan & Connell, 1989). External motivation, which involves acting in order to avoid punishments or receive rewards, lies on one extreme of the continuum; this motivation feels less autonomous, because the individual feels induced or pressured to act by an external contingency. Next along the continuum is introjected motivation, which implies acting to avoid feelings of guilt, or to prove oneself worthy; this motivation is somewhat more internalized or autonomous than external motivation. Next comes identified motivation, which reflects acting in accord with one’s own values. A child acting from identified motivation has found the behavior in question to be personally important, and has accepted it as his own. Lastly, some SDT researchers also distinguish integrated motivation as the most self-determined type of extrinsic motivation. Actions characterized by integrated motivation share many qualities with intrinsic motivation, but they are still considered extrinsic because they are performed in order to attain separable outcomes, rather than for their own sake.
As previously noted, SDT distinguishes extrinsic motivation from intrinsic motivation, which technically is not on the continuum and has the highest degree of self-determination; the person acting with intrinsic motivation acts out of pure enjoyment of the activity itself.
It has been shown that in the educational domain, the quality of the student’s motivation, with respect to the continuum, is associated with a number of important cognitive, behavioral, and emotional outcomes. Students who express more autonomous types of motivation (intrinsic and identified types of motivation) are more persistent and cognitively involved in their tasks, and display more positive coping styles and higher quality learning. By contrast, students who are motivated in a more controlled fashion (introjected and external types of motivation) expend less effort, are more easily distracted, experience more anxiety and other negative emotions, and have lower grades (Guay, Ratelle, & Chanal, 2008; Ryan & Connell, 1989; Taylor et al., 2014, Ryan & Deci, 2017; Gordeeva, Sychev, Gizhitskii, & Gavrichenkova, 2017).
There have been many instruments devised to measure academic motivation. The two most widely used questionnaires include the Academic Motivation Scale (AMS) and the SRQ-A. Vallerand and his colleagues (1989) developed the AMS, which assesses three types of intrinsic motivation (knowledge, accomplishment, and stimulation), three types of extrinsic motivation (identified, introjected, and external), and amotivation. The Russian version of the AMS was developed by Gordeeva et al. (2017) and is used for middle and high school students.
The Academic Self-Regulation Questionnaire (Ryan & Connell, 1989) is a self-report measure that has become one of the most prominent tools for assessing academic motivation within the primary and middle school context. This instrument deals with the reasons why the respondent carries out a certain behavior (Why do I do my homework? Why do I work on my classwork? Why do I try to answer hard questions in class? Why do I try to do well in school?). It also provides various possible preselected reasons that represent different motivational qualities with respect to the degree of relative autonomy — i.e.,intrinsic motivation, identified regulation, introjected regulation, and external regulation.
The SRQ-A has been widely used and applied across different cultures, including in North America (Grolnick, Ryan, & Deci, 1991); Germany (Kröner, Goussios, Schaitz, Streb, & Sosic-Vasic, 2017); Belgium (Vansteenkiste, Sierens, Soenens, Luyckx, & Lens, 2009); Italy (Alivernini, Lucidi, & Manganelli, 2011); Turkey (Bağçeci & Kanadli, 2014); Japan (Yamauchi & Tanaka, 1998); and China (Vansteenkiste, Zhou, Lens, & Soenens, 2005). It was also adapted into Spanish (Pichardo et al., 2018) and Portuguese (Gomes et al., 2019).
In general, these studies have provided support for the reliability and validity of SRQ-A; however, since some of them did not confirm the four-factor structure of the questionnaire and some scales showed low reliability, they also highlight the need for some adjustments, including research concerning its psychometric characteristics in different socio-cultural and school contexts. Some researchers have reduced the length of the questionnaire (Pichardo et al., 2018), and others have created their own versions of questionnaires based on the SRQ-A (Hayamizu, 1997; Chanal, Cheval, Courvoisier, & Paumier, 2019).
Study 1
Methods
Participants
The participants were 635 elementary and secondary school students (third and fourth graders) drawn from five regular schools located in Moscow and Biysk. The total sample comprised 325 girls and 304 boys (six children did not specify gender); the median age was 9.62, SD= 0.69, age range 8–11 years. The sample size was determined on the basis of the recommendation (see Kyriazos, 2018) that a sufficient sample for the analysis of ordinal data with WLSMV estimator must be comprised of no less than 200-500 participants.
Procedure
The questionnaires were administered to the students in group settings during regular class hours. The research was introduced as “a study of children’s views on life and study.” Parental consent to participate was obtained for all students.
Measures
Development of the Academic Self-Regulation Scale (Russian version). For the purposes of this study, we created the Russian version of the Academic Self-Regulation Questionnaire (SRQ-A) by adapting 32 items from the Ryan and Connell (1989) questionnaire. This questionnaire explores the reasons why the respondent displays a certain behavior, with questions such as: Why do I do my homework? Why do I work on my classwork? Why do I try to answer hard questions in class? Why do I try to do well in school? It also provides various possible preselected reasons that represent different motivational types— i.e.,intrinsic regulation, identified regulation, introjected regulation, and external regulation.
First, translation and back-translation of items from the original SRQ-A were performed by researchers fluent in both Russian and English, and expert in SDT; discrepancies were discussed and resolved by developing and pilot testing additional items similar in content to the original ones.
Then, in order to create a more robust, brief measurement tool which would correspond to the latest research in SDT, the main scales were reduced to four items per type of motivation, instead of the 7-8 items in the original questionnaire. Additional scales were developed which captured more broadly the dimensions of intrinsic motivation, positive introjection, and the two types of external motivation.
To specify: Following Vallerand’s ideas on diversity of intrinsic motivation (Vallerand et al., 1993), we developed two intrinsic regulation subscales, one to measure motivation to learn (a sample item is, “I do my homework because I like knowing new things”), and another for self-development motivation (a sample item is “because I like to improve myself”). In line with previous SDT research (Assor, Vansteenkiste, & Kaplan, 2009; Sheldon, Osin, Gordeeva, Suchkov, & Sychev, 2017), we also differentiated two introjected subscales, which capture self-controlled behavior by such processes as positive contingent self-esteem, concern with recognition, and feelings of pride (positive introjection); and shame, guilt, and negative contingent self-esteem (negative introjection). Sample items are “because I’ll respect myself more if I’ll do it” (positive introjection) and “because I’ll feel ashamed of myself if I don’t” (negative introjection). Finally, following Gagnéet al.’s work (2015) on the development of a work motivation scale which would capture more precisely the variety of external pressures that force people to work, we created a scale that assesses students’ perceptions of external pressures from teachers that force them to learn. Exemplary items are: “I have no choice, I have to work in class” (General), and “because my teacher would be happy if I do well in school” (Teachers). (See the full text of the questionnaire in Appendix).
To establish convergent validity, we used questionnaires to measure the students’ perceived autonomy support and autonomy frustration, perceived competence, and perceived relatedness. To evaluate the divergent validity of the scale, we administered questionnaires measuring attitude towards school, attitude towards teachers, and general sense of well-being, including satisfaction with life and self.
Basic psychological needs. Need satisfaction and frustration were measured with a questionnaire based on the Basic Psychological Need Satisfaction and Frustration Scale (Chen et al., 2015), which wasadjusted for schoolchildren by a group of three experts in SDT, including two professors and one graduate student.
The questionnaire included six scales, each of which comprised four items. The six were: 1) Autonomy satisfaction (α= 0.65); 2) autonomy frustration (α= 0.63); 3) competence satisfaction (α= 0.79); 4) competence frustration (α= 0.64); 5) relatednesssatisfaction (α= 0.76); and 6) relatedness frustration (α= 0.75). Participants responded to the options by completing the phrase, “Today in school I….” using a four-point Likert scale (1 = “Disagree” to 4 = “Agree”). Examples are: “I felt free and could choose what to do -- я чувствовал себя свободным и мог выбирать, что мне делать” (autonomy-support), “I was forced to do many uninteresting things -- я был вынужден делать слишком много неинтересных вещей” (autonomy-frustration), “I was successful in my studies -- я был успешным в учебе” (competence-support), “The teacher criticized me for my errors -- учитель критиковал меня за мои ошибки” (competence-frustration), “I had warm feelings towards those who were around me -- у меня были теплые чувства к тем, кто был рядом” (relatedness-support), “I felt like my classmates didn’t need me and were not interested in me -- я чувствовал, что не нужен и не интересен своим одноклассникам”. We tested the model with six interdependent factors (relevant to the scales) in this sample and obtained satisfactory values for the fit indexes: χ2= 557.17; df = 260; p < 0.001; CFI = 0.911; TLI = 0.897; RMSEA = 0.042; 90%-CI for RMSEA: 0.038-0.047; PCLOSE = 0.995; N = 635.
Students’ satisfaction with school and life. The students’ satisfaction with schoollife was assessed via the Perception of School subscale from the Multidimensional Students' Life SatisfactionScale (MSLSS; Huebner, 1994; Russian adaptation by Sychev, Gordeeva, Lunkina, Osin, & Sidneva, 2018). An additional scale was created by the authors to measure students’ relationships with teachers. Both the Perception of School and the Relationships with Teachers scales had six items, with items rated on 5-point Likert scales. Exemplary items are: “I do not really like my school” (School), and “I like to listen to my teachers” (Teachers). Cronbach’s alphas in the present sample were 0.87 and 0.89 respectively.
Additionally, a nonverbal measurement of general attitude towards school and towards life was employed (Andrews & Withey, 1976). It featured 7 faces with different expressions, ranging from most happy to least happy.
Data Analysis
Following the recommendations of Howard et al. (2018; 2020), we applied bifactorexploratory structural equation modeling (B-ESEM) to analyze the factor structure of the proposed questionnaire. It was recently shown (Howard et al., 2018) that bifactor analysis may be more suitable for questionnaires elaborating SDT because the general factor corresponds to the self-determination continuum itself, while the specific factors may capture different types of self-regulation. This method was successfully used for analysis of the structure of such instruments as the Multidimensional Work Motivation Scale (Howard et al., 2018; Howard et al., 2020), Academic Motivation Scale (Guay et al., 2015; Litalien et al., 2017), and several other questionnaires (Howard et al., 2020) in samples of children and adults. However, we failed to find any publications describing application of this method to the SRQ-A, which has a more complicated structure.
In our research the B-ESEM method was specified with a priori expectations about the factor structure, which included eight factors: A general (self-determination) factor and seven specific factors relevant to the scales of questionnaire:
-
Intrinsic Motivation: to know (IM),
-
Intrinsic Motivation: self-development (SM),
-
Identified Regulation (ID),
-
Introjected positive regulation (IP),
-
Introjected negative regulation (IN),
-
External regulation: general (EM),
-
External regulation: teacher (ET)
Analysis was conducted in Mplus 8 (Muthén & Muthén, 2015) using Bi-Geomin orthogonal target rotation: item loadings on the a priori motivation factors were freely estimated, and all cross-loadings were also freely estimated but “targeted” to be as close to zero as possible (Asparouhov & Muthén, 2009).
Further analysis of the factor structure of the SRQ included testing a series of alternative models using confirmatory factor analysis (CFA) in Mplus. Given the relatively small number of answer categories (four), we used a weighted least squares mean and variance adjusted (WLSMV) estimator in the ESEM and CFA analysis. Also, the “complex” type of analysis was used in the CFA to account for the nested sampling structure. Other statistical procedures, including descriptive statistics, correlations analysis, and t-tests, were carried out using R.
Results
We started analysis of the factor structure of the proposed questionnaire with B-ESEM and analyzed the 8-factor solution, which showed good fit: χ2= 218.89;df= 145; p < 0.001; CFI = 0.991; TLI = 0.980; RMSEA = 0.0;28, N = 635. As expected, factor loadings on the general factor for the items from the three autonomous regulation scales were high (more than 0.62); for the items from the introjected regulation scales, the loadings were moderate (from 0.26 to 0.48); they were negative or close to zero for the items of the external regulation scales (from –0.20 to 0.01).
Specific factor 1 corresponds to the first scale of intrinsic regulation, although the values of the loadings were quite moderate (from 0.20 to 0.32). Specificfactors 4-7 correspond well to the four scales of introjected and extrinsic regulation. At the same time, the specific factors 2 and 3, relevant to the scales of intrinsic regulation (to develop oneself) and identified regulation, contained low factor loadings. Although most items from these two scales showed weak loadings on the a priori factor, their loadings on the general factor were high (from 0.63 to 0.79), suggesting that these items were more efficient at tapping into global self-determination than specific autonomous motivation.
Four alternative models of the proposed questionnaire were tested with confirmatory factor analysis (CFA). The first model was a first-order model with seven factors reflecting the postulated scales. The second, alternative model replicated the seven-factor model, but added two second-order factors, representing intrinsic regulation and extrinsic regulation (see Figure 1). In the third model, the positive introjected regulation and negative introjected regulation factors were united into a single, second-order factor, so that the model contained three second-order factors representing intrinsic, introjected, and extrinsic regulation. In the fourth model, identified regulation was added into the second-order factor along with intrinsic and self-development motivation, forming the factor of autonomous regulation. The fourth model thus contained three second-order factors, reflecting autonomous, introjected, and extrinsic regulation. In every model no cross-loadings were hypothesized, and covariance between the latent factors was allowed.
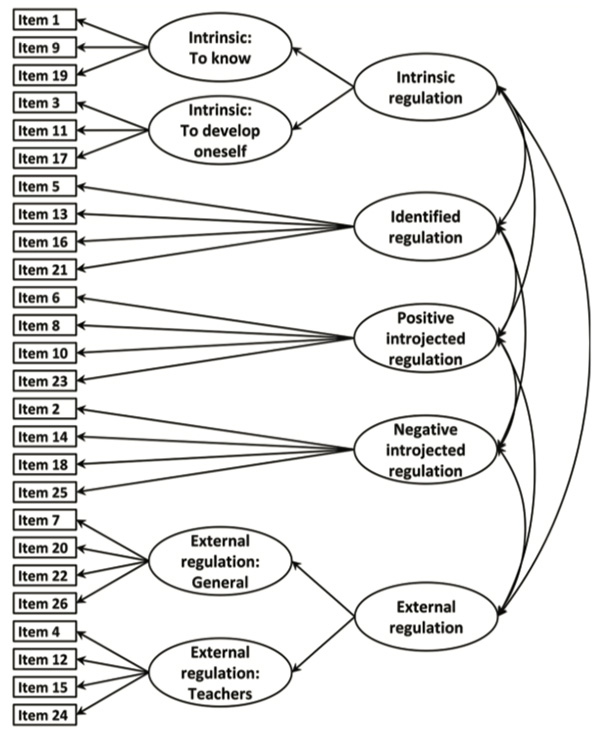
Figure 1. Factor structure of the academic motivation scales questionnaire (alternative model 2).
Fit indexes for these four models were within the acceptable range, and for the second and third ones, the values of the CFI, TLI, and RMSEA were best and almost identical (see Table 1). The fourth model showed a slightly worse fit. All things being equal, the second model, with second-order factors for intrinsic and extrinsic regulation (see Figure 1), was considered preferable, based on the acceptable fit across the reported indexes, and the parsimony of the model relative to Model 3. It was also confirmed to be the best model in Study 2, as reported below. All factor loadings for items in this model were higher than 0.50 and significant at p< 0.001.
Table 1
Comparison of the different CFA models (Study 1, N = 635)
|
Model |
χ2 |
df |
P-Value |
CFI |
TLI |
RMSEA |
SRMR |
|
1. One-level model with seven factors |
464.79 |
278 |
< 0.001 |
0.969 |
0.964 |
0.033 |
0.052 |
|
2. Two-level model with two second-level and three first-level factors |
460.01 |
285 |
< 0.001 |
0.971 |
0.967 |
0.031 |
0.052 |
|
3. Two-level model with three second-level and one first-level factors |
461.46 |
287 |
< 0.001 |
0.971 |
0.967 |
0.031 |
0.052 |
|
4. Two-level model with three second-level factors |
481.97 |
289 |
< 0.001 |
0.968 |
0.964 |
0.032 |
0.054 |
Note. df = Degrees of Freedom; CFI = Comparative Fit Index; TLI = Tucker-Lewis index; RMSEA = Root Mean-square Error of Approximation; SRMR = Root Mean Square Residual.
Correlations, reliability coefficients, and descriptive statistics of the seven subscales are presented in Table 2. As expected, the two intrinsic regulation scales and identified regulation were highly correlated (r > 0.71; p< .001). The two subscales for extrinsic regulation (teachers and general) were also strongly correlated, although the values of the coefficients were somewhat lower (r= 0.64; p< .001). In line with SDT, there was no positive association between intrinsic and extrinsic regulation, while both scales for introjected regulation, which occupy the middle of the self-determination continuum, showed positive correlations with both intrinsic and extrinsic types of regulation.
The values of Cronbach's αfor most of the scales were sufficient (α>.70, see Table 2), indicating good reliability of all scales except the negative introjected regulation scale, which had a lower but still acceptable reliability (α= .65). The moderate negative coefficients of skewness indicated that relatively high scores were more typical for all the scales.
Table 2
Descriptive statistics and correlations for academic motivation scales (Study 1, N = 635)
|
|
1 |
2 |
3 |
4 |
5 |
6 |
7 |
|
1. Intrinsic: To know |
– |
0.71*** |
0.66*** |
0.26*** |
0.27*** |
–0.07 |
–0.10* |
|
2. Intrinsic: To develop oneself |
0.72*** |
– |
0.73*** |
0.31*** |
0.30*** |
–0.08 |
–0.11** |
|
3. Identified regulation |
0.67*** |
0.73*** |
– |
0.37*** |
0.41*** |
–0.10* |
–0.12** |
|
4. Positive introjected |
0.26*** |
0.31*** |
0.37*** |
– |
0.48*** |
0.26*** |
0.26*** |
|
5. Negative introjected |
0.28*** |
0.31*** |
0.42*** |
0.49*** |
– |
0.26*** |
0.22*** |
|
6. Extrinsic: General |
–0.09* |
–0.08* |
–0.12** |
0.25*** |
0.24*** |
– |
0.65*** |
|
7. Extrinsic: Teachers |
–0.11** |
–0.11** |
–0.13*** |
0.25*** |
0.21*** |
0.64*** |
– |
|
Cronbach's α |
0.77 |
0.75 |
0.71 |
0.77 |
0.65 |
0.70 |
0.73 |
|
Mean |
2.78 |
3.20 |
3.25 |
2.88 |
3.10 |
2.83 |
2.78 |
|
SD |
0.89 |
0.76 |
0.70 |
0.84 |
0.72 |
0.82 |
0.84 |
|
Skewness |
–0.33 |
–0.92 |
–0.99 |
–0.45 |
–0.82 |
–0.33 |
–0.41 |
|
Kurtosis |
–0.90 |
0.26 |
0.54 |
–0.73 |
0.23 |
–0.78 |
–0.67 |
Note.*p < .05; **p < .01; ***p < .001. Above the diagonal partial correlations controlling for gender are presented. Numbers of variables in columns correspond to the numbers of variables in rows.
Next, we analyzed gender differences. T-tests revealed that girls had significantly higher intrinsic regulation (on both scales), identified regulation, and negative introjected regulation, while boys were significantly higher on the scale of general extrinsic regulation (see Table 3). The profile of academic motivation among girls, who on average had higher scores on identified and intrinsic self-development regulation, was more autonomous than was the boys’. Girls also demonstrated significantly higher satisfaction with school (t(623) = 3.14, p< 0.01), teachers (t(623) = 3.40, p< 0.001), and self (t(623) = 2.28, p< 0.05); better attitudes toward study (t(627) = 5.14, p< 0.001); and a higher satisfaction of the autonomy need (t(627) = 2.53, p< 0.05) and less frustration of this need (t(627) = 4.61, p< 0.001). Given the strong associations of gender with some measured variables, we used partial correlations to control for the impact of gender during further analysis.
Table 3
Gender differences by measured SRQ-A scales (study 1, N (girls) = 325, N (boys) = 304)
|
Means |
SD |
Student's t |
df |
p-value |
Cohen's d |
|||
|
Girls |
Boys |
Girls |
Boys |
|||||
|
Intrinsic: To know |
2.92 |
2.63 |
0.84 |
0.92 |
4.20 |
627 |
< .001 |
0.34 |
|
Intrinsic: To develop oneself |
3.28 |
3.10 |
0.72 |
0.80 |
2.99 |
627 |
0.029 |
0.24 |
|
Identified regulation |
3.39 |
3.11 |
0.63 |
0.74 |
5.10 |
627 |
< .001 |
0.41 |
|
Positive introjected regulation |
2.94 |
2.81 |
0.81 |
0.88 |
1.89 |
627 |
0.060 |
0.15 |
|
Negative introjected regulation |
3.18 |
3.02 |
0.69 |
0.74 |
2.94 |
627 |
0.003 |
0.23 |
|
Extrinsic regulation: General |
2.72 |
2.95 |
0.83 |
0.80 |
–3.55 |
627 |
< .001 |
–0.28 |
|
Extrinsic regulation: Teachers |
2.73 |
2.84 |
0.81 |
0.87 |
–1.65 |
627 |
0.100 |
–0.13 |
|
RAI |
0.26 |
–0.02 |
0.80 |
0.77 |
4.42 |
627 |
< .001 |
0.35 |
Note. SD — standard deviations; RAI — relative autonomy index.Significant differences marked in bold.
Simplex pattern. In line with prior empirical and theoretical work in SDT, the continuum of relative autonomy suggests that construct validity for the SRQ-A can be demonstrated when all its subscales are more strongly and positively correlated with those that are theoretically adjacent, than with those that are more distant (Ryan & Connell, 1989). The results of correlation analysis demonstrated that, in spite of the large number of scales, the overall pattern of correlations (see Table 1) supported the simplex pattern postulated by SDT.
To examine in a more formal manner the congruence between the pattern of obtained correlations and the simplex pattern, we calculated the value of the congruency coefficient (Ryan & Connell, 1989). The resulting value was 0.64, indicating satisfactory congruence between the empirical and theoretical patterns of correlations. Given that the hypothesis underlying the autonomy continuum had been confirmed, an unweighted relative autonomy index (RAI) was calculated following Sheldon et al. (2017), showing the relative dominance of autonomous regulation over controlled regulation. The RAI was calculated as the difference between the average value of the four relatively autonomous regulation scales (two intrinsic, identified, and positive introjected), and the average value of the controlled regulation scales (negative introjected and two extrinsic).
Convergent validity of the academic motivation scales was supported by correlations with other variables (see Table 4). As expected, the scales of basic psychological need satisfaction demonstrated moderate or high correlations with the autonomous regulation scales (0.29 ≤r ≤0.55; allp< .001), and moderate correlations with the introjected regulation scales (0.16 ≤r ≤0.31; allp< .001). Correlations of basic psychological need satisfaction with extrinsic regulation were close to zero and insignificant. Autonomy need frustration showed moderate positive correlations with both types of extrinsic regulation (r= 0.39 for EM and 0.43 for ET; bothp< .001), weak positive correlations with introjected regulation (r= 0.10 for both scales;p< .05), and was negatively correlated with the autonomous regulation scales (–0.23 ≤r ≤–0.16; allp< .001). Frustration of competence and relatedness needs showed almost zero negative correlations with intrinsic motivation scales, but they were positively correlated with extrinsic motivation scales (0.22 ≤r ≤0.31; allp< .001).
Table 4
Partial correlations between academic motivation scales and antecedents and outcomes variables, controlling for gender (study 1, N = 629)
Variable | IM | SM | ID | IP | IN | EM | ET | RAI |
Autonomy need: satisfaction | 0.55*** | 0.52*** | 0.46*** | 0.31*** | 0.25*** | 0.04 | 0.00 | 0.38*** |
Autonomy need: frustration | –0.23*** | –0.20*** | –0.16*** | 0.10* | 0.10* | 0.39*** | 0.43*** | –0.44*** |
Competence need: satisfaction | 0.45*** | 0.48*** | 0.47*** | 0.29*** | 0.22*** | –0.03 | –0.07 | 0.39*** |
Competence need: frustration | –0.07 | –0.06 | –0.08 | 0.17*** | 0.14*** | 0.31*** | 0.22*** | –0.24*** |
Relatedness need: satisfaction | 0.30*** | 0.30*** | 0.29*** | 0.24*** | 0.16*** | 0.04 | 0.03 | 0.21*** |
Relatedness need: frustration | –0.08* | –0.09* | –0.08* | 0.13*** | 0.11** | 0.24*** | 0.23*** | –0.22*** |
Satisfaction with school | 0.69*** | 0.57*** | 0.55*** | 0.17*** | 0.22*** | –0.16*** | –0.21*** | 0.56*** |
Satisfaction with teachers | 0.56*** | 0.49*** | 0.49*** | 0.22*** | 0.23*** | –0.07 | –0.14*** | 0.44*** |
Satisfaction with myself | 0.36*** | 0.36*** | 0.34*** | 0.31*** | 0.14*** | 0.03 | 0.02 | 0.29*** |
Attitude toward school | 0.60*** | 0.54*** | 0.50*** | 0.13*** | 0.20*** | –0.16*** | –0.16*** | 0.49*** |
Attitude toward life | 0.24*** | 0.27*** | 0.24*** | 0.11** | 0.05 | –0.08* | –0.06 | 0.25*** |
Note.*p < .05; **p < .01; ***p < .001. IM — Intrinsic regulation: To know; SM = Intrinsic regulation: To develop oneself; ID = Identified regulation; IP = Positive introjected regulation; IN = Negative introjected regulation; EM = Extrinsic regulation: General; ET = Extrinsic regulation: Teachers; RAI = relative autonomy index.
The divergent validity of the scales was also confirmed. Satisfaction with school was especially strongly correlated with intrinsic regulation and identified regulation (r ≥0.55; allp< .001). On the other hand, correlations of this variable with the both extrinsic regulation subscales were weak and negative. The satisfaction with teachers scale showed high correlations with autonomous regulation (0.49 ≤r ≤0.56; allp< .001), whereas its correlation with external (teachers) regulation was negative (r= –0.14; p< .001). Scales of attitude toward school and life showed a similar pattern of correlations. In general, all these scales were highly or moderately positively correlated with autonomous regulation, weakly positively correlated with both types of introjected regulation, and weakly negatively or insignificantly correlated with extrinsic regulation.
Next, we conducted Study 2 to test the reliability of the Russian SRQ-A and its applicability for middle school children, grades 5-7.
Study 2
Methods
Participants
The participants were 580 secondary school students drawn from two schools for specially selected (gifted) girls (N = 352 and N = 228). When we tested for differences between the groups on key study variables, none were found; hence we combined the samples for all subsequent analyses. Across this full sample (N= 580), the children were distributed thus: grade 5 (N= 192); grade 6 (N= 194); and grade 7 (N= 194).
Procedure
The same procedure was used as in Study 1.
The questionnaires were administered to the students in group settings during regular class hours. The research was introduced as “a study of children’s views on life and study.” Parental consent to participate was obtained for all students. Of the full sample (N= 580), at the end of the school year we obtained information on the academic achievement of 228 schoolchildren (final marks for four main subjects) from the respective school administrations.
Measures
The same scales of academic self-regulation and basic psychological needs as in Study 1 were used, with the exception of the scales on satisfaction with school life. In this study we used only one scale to measure need frustration (the autonomy need, given its central importance).The four factor model of the basic psychological needs scale, including three factors of basic need satisfaction and a factor for autonomy-frustration, showed sufficient fit: χ2= 271.42; df = 98; p < 0.001; CFI = 0.950; TLI = 0.938; RMSEA = 0.055 (90% CI = [0.048, 0.063]); PCLOSE = 0.128; N = 580. Cronbach’sαfor the scales of basic needs ranged from 0.71 to 0.88. Cronbach’s αfor academic self-regulation are presented in Table 7.
Data analyses
We applied the same data analysis procedures as in Study 1.
Results
As in Study 1, we started with B-ESEM. The eight-factorsolution showed a good fit (χ2= 234.02; df= 145; p < 0.001; CFI = 0.991; TLI = 0.981; RMSEA = 0.033) and the expected pattern of loadings on the general self-determination factor. As in Study 1, the specific factors relevant to the scales of intrinsic regulation (to develop oneself) and identified regulation contained low factor loadings. At the same time, factor loadings of the items from these two scales on the general factor of self-determination were high (from 0.74 to 0.87).The remaining specific factors corresponded well to the scales of the questionnaire.
The results of CFA for the four alternative factor models (the same ones used in Study 1) for the Academic Self-regulation Questionnaire are presented in Table 5. The best fit, although slightly worse than in Study 1, was obtained for the second model, which included two second-order factors for intrinsic and extrinsic regulation (see Figure 1). All factor loadings for items in this model were higher than 0.50 and significant at p< 0.001.
Table 5
Comparison of the different CFA models (Study 2, N = 580)
Model | χ2 | df | P-Value | CFI | TLI | RMSEA | SRMR |
1. One-level model with seven factors | 923.87 | 278 | < 0.001 | 0.944 | 0.934 | 0.063 | 0.065 |
2. Two-level model with two second-level and three first-level factors | 898.60 | 285 | < 0.001 | 0.947 | 0.939 | 0.061 | 0.065 |
3. Two-level model with three second-level and one first-level factors | 1203.47 | 287 | < 0.001 | 0.920 | 0.910 | 0.074 | 0.079 |
4. Two-level model with three second-level factors | 1235.60 | 289 | < 0.001 | 0.917 | 0.907 | 0.075 | 0.081 |
Note. df = Degrees of Freedom; CFI = Comparative Fit Index; TLI = Tucker-Lewis index; RMSEA = Root Mean-square Error of Approximation; SRMR = Root Mean Square Residual.
Correlations, reliability coefficients, and descriptive statistics of the seven subscales are presented in Table 6. The values of Cronbach's αfor all scales were high (α>.74), indicating good reliability. The scales of self-development and identified regulation had strong asymmetry, while the other scales had moderate asymmetry. The pattern of correlations between the scales was quite similar to that found in Study 1 and met expectations based on SDT. The congruency coefficient was a bit lower than in Study 1, but remained satisfactory (0.56), which confirmed the simplex pattern assumption.
Table 6
Descriptive statistics and correlations for academic motivation scales (study 2, N = 580)
| 1 | 2 | 3 | 4 | 5 | 6 | 7 |
1. Intrinsic: To know | – |
| |||||
2. Intrinsic: To develop oneself | 0.71*** | – |
| ||||
3. Identified regulation | 0.74*** | 0.75*** | – |
| |||
4. Introjected regulation (positive) | 0.35*** | 0.36*** | 0.41*** | – |
| ||
5. Introjected regulation (negative) | 0.16*** | 0.16*** | 0.27*** | 0.41*** | – |
| |
6. Extrinsic regulation (general) | –0.26*** | –0.22*** | –0.20*** | 0.09* | 0.36*** | – |
|
7. Extrinsic regulation (teachers) | –0.25*** | –0.24*** | –0.18*** | 0.04 | 0.32*** | 0.67*** | – |
Cronbach's α | 0.82 | 0.78 | 0.75 | 0.81 | 0.74 | 0.74 | 0.76 |
Mean | 3.27 | 3.61 | 3.59 | 3.24 | 3.01 | 2.48 | 2.52 |
SD | 0.66 | 0.49 | 0.48 | 0.65 | 0.67 | 0.73 | 0.73 |
Skewness | –0.78 | –1.26 | –1.29 | –0.94 | –0.63 | 0.07 | –0.02 |
Kurtosis | 0.13 | 1.25 | 1.56 | 0.69 | –0.02 | –0.61 | –0.44 |
Note.*p < .05; **p < .01; ***p < .001. Numbers of variables in columns correspond to the numbers of variables in rows.
Convergent validity of the academic motivation scales was supported by correlations with the four basic psychological needs subscales (see Table 7). Again, all the scales of satisfaction of basic psychological needs demonstrated moderate or high correlations with autonomous regulation scales (0.36 ≤r ≤0.61; allp< .001), moderate correlations with positive introjected regulation (0.26 ≤r ≤0.33; allp< .001); zero correlations with introjected negative regulation; and negative correlations with extrinsic regulation (–0.30 ≤r ≤–0.17; allp< .001). Similar correlations, but in the inverse direction, were obtained for autonomy frustration.
Table 7
Correlations between academic motivation scales and antecedents and outcomes variables (Study 2)
Variable | N | IM | SM | ID | IP | IN | EM | ET | RAI |
Autonomy support | 575 | 0.61*** | 0.50*** | 0.53*** | 0.26*** | 0.07 | –0.26*** | –0.22*** | 0.49*** |
Autonomy frustration | 575 | –0.53*** | –0.46*** | –0.45*** | –0.17*** | –0.05 | 0.34*** | 0.29*** | –0.50*** |
Competence support | 575 | 0.57*** | 0.47*** | 0.51*** | 0.33*** | 0.02 | –0.24*** | –0.30*** | 0.48*** |
Relatedness support | 575 | 0.41*** | 0.36*** | 0.41*** | 0.28*** | 0.02 | –0.17*** | –0.22*** | 0.35*** |
Attitude toward school | 575 | 0.62*** | 0.53*** | 0.54*** | 0.25*** | 0.08 | –0.25*** | –0.22*** | 0.50*** |
Attitude toward life | 580 | 0.36*** | 0.32*** | 0.32*** | 0.17*** | 0 | –0.14*** | –0.10* | 0.29*** |
Academic achievement | 228 | 0.16* | 0.19** | 0.26*** | 0.20** | 0.12 | –0.16* | –0.19** | 0.19** |
Note.*p < .05; **p < .01; ***p < .001. IM = Intrinsic Motivation: to know, SM = Intrinsic Motivation: self-development, ID = Identified Regulation, IP = Introjected positive regulation, IN = Introjected negative regulation, EM = External regulation: general, ET = External regulation: teacher.
Divergent validity of the scales was also confirmed. Attitude toward school was highly correlated with the autonomous regulation scales (0.53 ≤r ≤0.62; allp< .001), while correlations with extrinsic regulation scales were weak and negative (–0.25 for EMand –0.22 for ET; bothp< .001). Attitude toward life moderately correlated with autonomous regulation scales (0.32 ≤r ≤0.36; allp< .001), and correlations with extrinsic regulation scales were weak and negative. The highest and most significant correlation with academic achievement was obtained for the scale of identified motivation (r= 0.26; p< .001), while other scales correlated more weakly with GPA (r≤0.20), and with lower p-values.
Discussion
The aim of the present study was to evaluate the utility of the Russian version of the SRQ-A as a self-report measure for academic motivation, by reporting psychometric properties, examining the factorial structure of the SRQ-A, and assessing construct validity in a large sample of primary and middle school children. Internal consistency for the four original subscales showed moderate to high reliability, ranging from 0.62 to 0.82 (Ryan & Connell, 1989). The results of both studies with Russian samples also indicated adequate levels of internal consistency for all subscales of the Russian version of the SRQ-A.
The factor structure of the questionnaire was analyzed using two approaches: B-ESEM and CFA. The results of the B-ESEM supported the conclusion that the scales of the questionnaire occupy the expected place in the self-determination continuum. The results of the CFA indicated that the hierarchical model of the questionnaire’s structure is preferable; i.e.,the one where second order factors of intrinsic and external regulation combined the relevant subscales.
Such a hierarchical structure may explain some difficulties in extracting specific factors of autonomous regulation in the B-ESEM. The reason why the factor loadings relevant to the scales of intrinsic regulation (to develop oneself) and identified regulation (autonomous types of motivation) were low may reflect the fact that the SRQ-A questionnaire includes four different learning situations. Results from previous studies revealed that autonomous motivation was more specific to the situational level than was controlled motivation (Chanal & Guay, 2015; Chanal & Paumier, 2020).
In both studies, correlations among the seven SRQ-A subscales revealed a simplex pattern consistent with the assumption of the continuum of self-determination, where theoretically adjacent subscales have stronger positive correlations than more distant subscales (Ryan & Connell, 1989). The results of both studies also demonstrated that the subscales showed good convergent and discriminant validity with measures of basic psychological needs, attitudes toward school, school well-being, and general well-being.
The results showed that at the primary school age (Study 1), children had a certain amount of trouble differentiating between positive and negative introjected motivation. As a result, shame and pride in their accomplishments had similar associations with both motivational antecedents and outcome variables. However, during adolescence (Study 2), such a differentiation increased (together with reliability of these scales), and the distinction between these two types of introjected regulation became justified and meaningful.
The pattern of gender differences in academic motivation which was demonstrated in the first study, which indicated greater autonomous and less external regulation in girls, adequately explains the higher academic achievements of girls, and completely coincides with a similar pattern recently discovered in a sample of German schoolchildren (Kroner et al., 2017).
Conclusion
We developed the Russian version of the modified Academic Self-Regulation Scale (SRQ-A), and tested its factorial structure and validity in two samples of Russian children in primary and middle/secondary school. The results from the Russian version of the SRQ-A were related in the expected directions with other constructs, antecedents, and outcomes of academic motivation.
Limitations
The present version of the Russian SRQ-A has been validated in an academic context with students attending grades three to seven. Thus, its application to earlier age groups remains to be tested. Also, the Russian SRQ-A is a self-report questionnaire, and hence is subject to various distortions in perception. It is recommended for future studies to investigate teacher and parental reports, which might be useful in gaining a more holistic insight into the students’ motivational mechanisms. Also, since the sample of middle school students (Study 2) was restricted to girls, its validity and generalizability for boys should be confirmed. However, previous studies (Kröner et al., 2017), as well as our own data on elementary school children, show, among other things, that boys and girls do not differ much in their patterns of motivation.
Acknowledgements
This research was supported by the Russian Foundation of Basic Research (Project No. 18-013-00386).
References
Alivernini, F., Lucidi, F., & Manganelli, S. (2011). Psychometric properties and construct validity of a scale measuring self-regulated learning: Evidence from the Italian PIRLS data. Procedia Social and Behavioral Sciences, 15, 442–446. https://doi.org/10.1016/j.sbspro.2011.03.118
Andrews, F.M., & Withey, S.B. (1976). Social indicators of well-being: Americans’ perceptions of life quality. New York: Plenum Press. https://doi.org/10.1007/978-1-4684-2253-5
Asparouhov, T., & Muthén, B. (2009). Exploratory structural equation modeling. Structural Equation Modeling: A Multidisciplinary Journal, 16(3), 397–438.
Assor, A., Vansteenkiste, M., & Kaplan, A. (2009). Identified versus introjected approach and introjected avoidance motivations in school and in sports: The limited benefits of self-worth strivings. Journal of Educational Psychology, 101(2), 482–497. https://doi.org/10.1037/a0014236
Bağçeci, B., & Kanadli, S. (2014). The study of adapting self-regulation questionnaire into Turkish. Journal of Education and Human Development, 3(3), 271–281. https://doi.org/10.15640/jehd.v3n3a22.
Chanal, J., Cheval, B., Courvoisier, D.S., & Paumier, D. (2019). Developmental relations between motivation types and physical activity in elementary school children. Psychology of Sport & Exercise, 43, 233–242. https://doi. org/10.1016/j.psychsport.2019.03.006
Chanal, J., & Guay, F. (2015). Are Autonomous and Controlled Motivations School-Subjects-Specific?. PloS one, 10(8), e0134660. https://doi.org/10.1371/journal.pone.0134660
Chanal, J., & Paumier, D. (2020). The school-subject-specificity hypothesis: Implication in the relationship with grades. PloS one, 15(4), e0230103. https://doi.org/10.1371/journal.pone.0230103
Chen, B., Vansteenkiste, M., Beyers, W., Boone, L., Deci, E.L., Duriez, B, … Verstuyf, J. (2015). Basic psychological need satisfaction, need frustration, and need strength across four cultures. Motivation and Emotion, 39, 216–236. https://doi.org/10.1007/s11031-014-9450-1
Gagné, M., Forest, J., Vansteenkiste, M., Crevier-Braud, L., Broeck, A. van den, Aspeli, A.K., … Westbye, C. (2015). The Multidimensional Work Motivation Scale: Validation evidence in seven languages and nine countries. European Journal of Work and Organizational Psychology, 24(2), 178–196. https://doi.org/10.1080/1359432X.2013.877892
Gomes, M., Monteiro, V., Mata, L., Peixoto, F., Santos, N., & Sanches, C. (2019). The Academic Self-Regulation Questionnaire: a study with Portuguese elementary school children. Psicologia: Reflexão e Crítica, 32(1), 8. https://doi.org/10.1186/s41155-019-0124-5
Gordeeva, T.O., Sychev, O.A., Gizhitskii, V.V., & Gavrichenkova, Т.К. (2017). Intrinsic and Extrinsic Academic Motivation Scale for Schoolchildren. Psikhologicheskaya Nauka i Obrazovanie [Psychological Science and Education], 22(2), 65–74. https://doi.org/10.17759/pse.2017220206
Grolnick, W.S., Ryan, R.M., & Deci, E.L. (1991). Inner resources for school achievement: Motivational mediators of children’s perceptions of their parents. Journal of Educational Psychology, 83(4), 508–517. https://doi.org/10.1037/0022-0663.83.4.508
Guay, F., Ratelle, C.F., & Chanal, J. (2008). Optimal Learning in Optimal Contexts: The role of self-determination in Education. Canadian Psychology, 49(3), 233–240. https://doi.org/10.1037/a0012758
Guay, F., Morin, A.J.S., Litalien, D., Valois, P., Vallerand, R.J. (2015). Application of Exploratory Structural Equation Modeling to Evaluate the Academic Motivation Scale. The Journal of Experimental Education, 83(1), 51–82, https://doi.org/10.1080/00220973.2013.876231
Hayamizu, T. (1997). Between intrinsic and extrinsic motivation: Examination of reasons for academic study based on the theory of internalization. Japanese Psychological Research, 39(2), 98–108. https://doi.org/10.1111/1468-5884.00043
Howard, J.L., Gagné, M., Morin, A.J., & Forest, J. (2018). Using bifactor exploratory structural equation modeling to test for a continuum structure of motivation. Journal of Management, 44(7), 2638–2664. https://doi.org/10.1177/0149206316645653
Howard, J.L., Gagné, M., Van den Broeck, A., Guay, F., Chatzisarantis, N., Ntoumanis, N., & Pelletier, L.G. (2020). A review and empirical comparison of motivation scoring methods: An application to self-determination theory. Motivation and Emotion, 44, 534–548. https://doi.org/10.1007/s11031-020-09831-9
Huebner, E.S. (1994). Preliminary development and validation of a multidimensional life satisfaction scale for children. Psychological Assessment, 6(2), 149–158. https://doi.org/10.1037/1040-3590.6.2.149
Kröner, J., Goussios, C., Schaitz, C., Streb, J., & Sosic-Vasic, Z. (2017). The construct validity of the German Academic Self-Regulation Questionnaire (SRQ-A) within primary and secondary school children. Frontiers in Psychology, 8, 1032. https://doi.org/10.3389/fpsyg.2017.01032
Kyriazos, T.A. (2018). Applied psychometrics: sample size and sample power considerations in factor analysis (EFA, CFA) and SEM in general. Psychology, 9(08), 2207–2230. https://doi.org/10.4236/psych.2018.98126
Litalien, D., Morin, A.J.S., Gagné, M., Vallerand, R.J., Losier, G.F., & Ryan, R.M. (2017). Evidence of a continuum structure of academic self-determination: A two-study test using a bifactor-ESEM representation of academic motivation. Contemporary Educational Psychology, 51, 67–82. https://doi.org/10.1016/j.cedpsych.2017.06.010
Muthén, L.K., & Muthén, B.O. (2015). Mplus User’s Guide. Eighth Edition. Los Angeles, CA: Muthén & Muthén.
Pichardo, M.C., Cano, F., Garzón-Umerenkova, A., de la Fuente, J., Peralta-Sánchez, F.J., & Amate-Romera, J. (2018). Self-Regulation Questionnaire (SRQ) in Spanish Adolescents: Factor Structure and Rasch Analysis. Frontiers in Psychology,9, 1370. https://doi.org/10.3389/fpsyg.2018.01370
Ryan, R.M., & Connell, J.P. (1989). Perceived locus of causality and internalization: examining reasons for acting in two domains. Journal of Personality and Social Psychology, 57(5), 749–761. https://doi.org/10.1037//0022-3514.57.5.749
Ryan, R.M., & Deci, E.L. (2000). Intrinsic and Extrinsic Motivations: Classic Definitions and New Directions. Contemporary Educational Psychology, 25(1), 54–67. https://doi.org/10.1006/ceps.1999.1020
Ryan, R.M., & Deci, E.L. (2017). Self-determination theory: Basic psychological needs in motivation, development, and wellness. Guilford Publications.
Sheldon, K. M., Osin, E. N., Gordeeva, T. O., Suchkov, D. D., & Sychev, O. A. (2017). Evaluating the Dimensionality of Self-Determination Theory’s Relative Autonomy Continuum. Personality and Social Psychology Bulletin,43(9), 1215–1238. https://doi.org/10.1177/0146167217711915
Sychev, O. A., Gordeeva, Т. О., Lunkina, M. V., Osin, E. N., & Sidneva, A. N. (2018). Multidimensional Students’ Life Satisfaction Scale. Psikhologicheskaya Nauka i Obrazovanie [Psychological Science and Education], (6), 5–15. https://doi.org/10.17759/pse.2018230601
Taylor, G., Jungert, T., Mageau, G.A., Schattke, K., Dedic, H., Rosenfield, S., & Koestner, R. (2014). A self-determination theory approach to predicting school achievement over time: The unique role of intrinsic motivation. Contemporary Educational Psychology, 39(4), 342–358. https://doi.org/10.1016/j.cedpsych.2014.08.002
Vallerand, R.J., Pelletier, L.G., Blais, M.R., Briere, N.M., Senecal, C., & Vallieres, E.F. (1993). On the Assessment of Intrinsic, Extrinsic, and Amotivation in Education: Evidence on the Concurrent and Construct Validity of the Academic Motivation Scale. Educational and Psychological Measurement, 53(1), 159–172. https://doi.org/10.1177/0013164493053001018
Vansteenkiste, M., Sierens, E., Soenens, B., Luyckx, K., & Lens, W. (2009). Motivational Profiles from a Self-Determination Perspective: The Quality of Motivation Matters. Journal of Educational Psychology, 101(3), 671–688. https://doi.org/10.1037/a0015083
Vansteenkiste, M., Zhou, M., Lens, W., & Soenens, B. (2005). Experiences of Autonomy and Control Among Chinese Learners: Vitalizing or Immobilizing? Journal of Educational Psychology, 97(3), 468–483. https://doi.org/10.1037/0022-0663.97.3.468
Yamauchi, H., & Tanaka, K. (1998). Relations of Autonomy, Self-Referenced Beliefs, and Self-Regulated Learning among Japanese Children. Psychological Reports,82(3), 803–816. https://doi.org/10.2466/pr0.1998.82.3.803
Appendix. SRQ-A (Russian)
Инструкция: Внимательно прочти приведенные ниже утверждения, ничего не пропуская и отметь ответ, наиболее подходящий для тебя. (Instructions: Carefully read the statements below and mark the answer that is most suitable for you.)
Неверно (НЕТ), Скорее неверно, Скорее верно, Верно (ДА)
(Not at all true, Not very true, Sort of true, Very true)
Почему я делаю домашние задания?
А. Я делаю домашние задания, потому что…
(Why I Do Things?
A. Why do I do my homework? I do my homework because…)
1. мне нравится делать уроки (I like to do my assignments).2. мне стыдно получать плохие отметки (I am ashamed to get bad grades.)
3. мне нравится знать и уметь все больше и больше (I like to know and be able to do more and more.)
4. если не сделаю, учитель будет ругать меня (If I don’t, the teacher will scold me.)
5. мне самому важно делать домашние задания (It’s important for me to do my homework.)
6. я буду хорошо думать о себе, если сделаю задания (I will think well of myself if I do the assignments.)
7. родители контролируют меня и проверяют мои оценки (My parents control me and check my grades.)
8. выполнив домашнюю работу, я себя больше уважаю (When I’ve done my homework, I respect myself more.)
Б. Почему я работаю над заданиями в классе? Я работаю над заданиями в классе, потому что... (B. Why do I work on my classwork? I work on my class assignments because ...)
9. мне это интересно (It's interesting to me.)
10. я буду больше уважать себя, выполнив эти задания (I will respect myself more by completing these tasks.)
11. мне приятно развиваться (I enjoy developing my skills.)
12. от меня этого требует учитель (The teacher requires me to do it.)
13. я сам хочу выучить новый материал (I myself want to learn new material.)
14. мне будет стыдно за себя, если я их не сделаю (I will be ashamed of myself if I do not.)
B. Почему я стараюсь ответить на трудные вопросы в классе? Я стараюсь ответить на трудные вопросы в классе, потому что…
(C. Why do I try to answer hard questions in class? I try to answer hard questions in class because ...)
15. учитель требует, чтобы я пытался отвечать на эти вопросы (The teacher requires me to try to answer these questions.)
16. я сам хочу отвечать на трудные вопросы (I myself want to answer difficult questions.)
17. мне нравится учиться думать (I like learning to think.)
18. я буду плохо о себе думать, если не отвечу (I will think badly of myself if I do not answer.)
Г. Почему я стараюсь хорошо учиться в школе? Я стараюсь хорошо учиться в школе, потому что… (D. Why do I try to do well in school? I try to do well in school, because…)
19. мне доставляет удовольствие учиться (It gives me pleasure to study.)
20. я обязан(а) учиться, иначе у меня будут проблемы (I’m obligated to study, otherwise I will have problems.)
21. для меня важно хорошо учиться (It is important for me to do well in school.)
22. если я стану хуже учиться, то меня накажут (If I begin to study worse, then they will punish me.)
23. я буду гордиться собой, если буду учиться хорошо (I will be proud of myself if I study well.)
24. я должен стараться, чтобы учитель не ругал (I must try so that the teacher does not scold me.)
25. мне будет стыдно учиться плохо (I will be ashamed to study poorly).
26. родители требуют, чтобы я хорошо учился (My parents require me to study well.)
Scoring key for SRQ-A-ru.
Intrinsic Motivation: to know 1, 9, 19,
Intrinsic Motivation: self-development 3, 11, 17,
Identified Regulation 5, 13, 16, 21,
Introjected positive regulation 6, 8, 10, 23,
Introjected negative regulation 2, 14, 18, 25,
External regulation: general 7, 20, 22, 26,
External regulation: teacher 4, 12, 15, 24.
To cite this article: Gordeeva, T.O., Sychev, O.A., Lynch, M.F. (2020). The Construct Validity of the Russian Version of the Modified Academic Self-Regulation Questionnaire (SRQ-A) among Elementary and Middle School Children. Psychology in Russia: State of the Art, 13(3), 16-34.
The journal content is licensed with CC BY-NC “Attribution-NonCommercial” Creative Commons license.


