New Psychometric Evidence of a Bifactor Structure of the Emotional Regulation Questionnaire (ERQ) in Ecuadorian College Students
Moreta-Herrera, R.  Pontifical Catholic University of Ecuador, Ambato, Ecuador University of Girona, Spain
Perdomo-Pérez, M.
Universidad de Ibagué, Ibagué, Colombia
Vaca-Quintana, D.
Universidad Tecnológica Indoamérica, Ambato, Ecuador
Sánchez-Vélez, H.
Ministerio de Salud Pública del Ecuador, Quito, Ecuador
Camacho-Bonilla, P.
Pontifical Catholic University of Ecuador, Ambato, Ecuador
Vásquez de la Bandera, F.
Universidad Técnica de Ambato, Ambato, Ecuador
Dominguez-Lara, S.
University of San Martin de Porres, Peru
Caycho-Rodríguez, T.
Universidad Privada del Norte, Lima, Perú
Abstract
Background. Emotion Regulation comprises a set of strategies (cognitive, emotional, and physiological) that allow individuals faced with internal or external stimuli to manage their emotional response, to adapt to the environment, and to achieve goals. The Emotion Regulation Questionnaire (ERQ) is used to assess Emotion Regulation. It has been translated into several languages (including Spanish) and has been adapted around the world, but its psychometric properties have not been tested in Ecuador.
Objective. To confirm the bifactor structure of the Emotion Regulation Questionnaire and its reliability in a sample of Ecuadorian college students.
Design. A quantitative and instrumental study using Confirmatory Factor Analysis with Robust Maximum Likelihood estimation. The sample consisted of 400 participants (62.5% women), aged 18 to 25 (M = 21.1; SD = 1.95) from two universities in Ecuador and seven different undergraduate courses.
Results. The bifactor model of the test is confirmed with an adequate adjustment ꭓ2 = 35.99; p > .001; ꭓ2/df = 1.43; CFI = .98; TLI = .96; SRMR = .034; and RMSEA = .033 CI95%: [.033–.052]; ωH = .70; ωHs1 = .23; ωHs2 = .35. Reliability is high with ω = .86 CI95%: [.81–.88].
Conclusion. The bifactor model of the ERQ is an adequate and reliable test to assess Emotion Regulation among Ecuadorian college students.
Received: 31.03.2021
Accepted: 20.01.2022
PDF: http://psychologyinrussia.com/volumes/pdf/2022_1/Psychology_1_2022_120-134_Moreta.pdf
Pages: 120–134
DOI: 10.11621/pir.2022.0108
Keywords: Confirmatory Factor Analysis; emotion regulation; reliability; students; validity
Introduction
Emotion Regulation (ER) comprises a set of strategies (cognitive, emotional, and physiological) that allow individuals faced with internal or external stimuli to manage their emotional response, to adapt to the environment, and to achieve goals (Gross, 1999; Gross & John, 2003). Research in ER has grown exponentially due to the important role it plays in social adaptation and the development of certain psychopathologies (Aldao et al., 2010; Zumba-Tello & Moreta-Herrera, 2022), but also in the integral development of a person (Momeñe et al., 2017).
The Emotion Regulation Questionnaire (ERQ) (Gross & John, 2003) is used to evaluate ER; it is composed of 10 items and assesses two independent regulation strategies:
-
Cognitive Reappraisal (CR), an anticipatory strategy that allows reinterpretation and evaluation of context before the emotional response to modulate behavior when faced with triggering stimuli. Cognitive reappraisal is measured by six questions, such as: “When I want to feel a more positive emotion (such as joy or amusement), I change what I’m thinking about” or “When I want to feel a less negative emotion (such as sadness or anger), I change what I’m thinking about”.
-
Emotion Suppression (ES), which allows the modulation of emotions while the individual experiences them, is measured by four questions, such as: “I keep my emotions to myself” or “When I am feeling positive emotions, I am careful not to express them” (Aldao et al., 2010; Balzarotti et al., 2010; Gross, 2007). The ERQ shows a Likert-type structure with seven response options, where 1 corresponds to “strongly disagree” and 7 corresponds to “strongly agree”.
The ERQ has been translated into several languages and validated around the world. Evidence of a two-factor orthogonal model (CR and ES without correlation) was presented in Italy (Balzarotti et al., 2010); Germany (Abler & Kessler, 2009); Spain (Cabello et al., 2013; Rodríguez-Carvajal et al., 2006); Portugal (Teixeira et al., 2015); Australia and the United Kingdom (Spaapen et al., 2014), and the USA (Preece et al., 2021); while studies showed evidence of a two-factor oblique model (CR and ES correlated) in Sweden (Enebrink et al., 2013); Peru (Gargurevich & Matos, 2010); Ecuador (Moreta-Herrera et al., 2018; Moreta-Herrera et al., 2021a), and Australia (Preece et al., 2020). Both two-factor adjustment models (orthogonal and oblique), present adequate internal consistency reliability as well as convergent validity when compared with other tests (health, well-being, emotional intelligence, among others). In the case of Ecuador, no studies on the factorial structure of the ERQ have been found in the scientific literature, which raises the importance of the present research.
Methodological Implications of the Validation of Tests
Having tests translated, adjusted, and adapted to the context in which the ERQ or any other test is applied is one of the challenges of evidence-based instrumental research. Contemporary empirical research has focused more on social and psychic phenomena than on the development and validation of assessment tools. The use of assessment tools without proper instrumental validation can compromise results from the beginning, due to the absence of calibration (Moreta-Herrera et al., 2019), which leads to measurement errors and biases (Elosua, 2003). This can also cause errors in decision making, testing hypotheses, and diagnosis (Rönkkö et al., 2015).
Many researchers do not report the proper nature of the test items (commonly a Likert-type scale), which is problematic, since depending on the number of options, they may assume an ordinal (five options or less) or continuous (more than five options) nature. This is relevant because multivariate normality is usually less likely in the former. In addition, the absence of multivariate normality is very common in social science research (Jin & Cao, 2018; Li, 2016). This results in the incorrect use of statistical tests during the validation processes, which do not correspond to the nature of the items or the assumption of multivariate normal distribution (Sullivan & Artino, 2013). These errors are observed in different statistical validation and reliability processes such as Exploratory Factor Analysis (EFA) with Principal Components Analysis (PCA), Confirmatory Factor Analysis (CFA) with Maximum Likelihood (ML), internal consistency reliability with Cronbach’s alpha (α), among others.
Considerations in Confirmatory Factor Analysis and Reliability
CFA is a statistical method widely used as evidence for the construct validity of a measure (Ferrando & Anguiano-Carrasco, 2010). It requires a considerable sample size (Brown, 2015), the confirmation of multivariate normality (Cain et al., 2017), and the nature of the variables (categorical, ordinal, or interval) (Hair et al., 2004). The treatment of data and the decision whether to employ normal or robust estimators will depend on whether these criteria are met.
CFA is generally calculated with the Maximum Likelihood Estimation method (ML) (Li, 2016), which assumes that the observed indicators (items) follow a continuous and multivariate normal distribution (Myung, 2003). In the case of psychological tests, this is not the most suitable method, as items usually have an ordinal nature (Gitta & Bengt, 2009) and continuous multivariate normal distribution is unlikely (Holtmann et al., 2016). Therefore, CFA requires estimators appropriate to these characteristics such as the Diagonally Weighted Least Squares (DWLS) method or robust estimations such as Robust Maximum Likelihood (MLR) or Weighted Least Squares with Adjusted Mean and Variance (WLSMV) (Jin & Cao, 2018). These methods, especially MLR, are recommended, as they reduce biases compared to ML. This helps to obtain stronger evidence of validity, regardless of the number of categories of the item and without multivariate normal distribution as long as a large sample size is analyzed (n > 200) (Li, 2016).
Previous studies confirm an orthogonal two-factor model (Abler & Kessler, 2009; Balzarotti et al., 2010; Cabello et al., 2013; Preece et al., 2021; Rodríguez-Carvajal et al., 2006; Spaapen et al., 2014; Teixeira et al., 2015) of the ERQ (Gross & Jhon, 2003), although an alternative configuration of an oblique two-factor model is also proposed (Enebrink et al., 2013; Gargurevich & Matos, 2010; Moreta-Herrera et al., 2018; Preece et al., 2020). The different configurations of the models in these studies are probably due to particular characteristics of the reference samples, differences in language, and the estimators used in factor analysis (ML estimation is predominant in validation studies, which induces a greater measurement bias) (Caycho-Rodríguez et al., 2021; Jonason et al., 2020; Moreta-Herrera et al., 2021b).
Due to the presence of moderate factor correlations in preliminary studies, there is likely to be a third latent factor that groups all the items of the scale into a single factor; this would be explained through a bifactor model composed of a general factor (GF) and two specific factors (SF). This model best represents the multidimensionality of the construct and recognizes the uniqueness of the factors that compose it, but also the binding capacity of the items in a general factor (Stefansson et al., 2016), allowing a better interpretation of the factors as well as a global reading of the construct, so its use is becoming more common in validation studies. In the case of the ERQ, there is no preliminary evidence of a bifactor adjustment model.
Something similar occurs when determining the internal consistency reliability of the ERQ through Cronbach’s alpha coefficient (α) (Sijtsma, 2009), a test that requires a significant number of cases for its analysis, as well as a continuous multivariate normal distribution. However, evidence suggests that using Cronbach’s alpha is not ideal for this purpose (Trizano-Hermosilla & Alvarado, 2016), due to the ordinal nature of the items; Cronbach's alpha does not consider this aspect, and its use is recommended only when the measurement scale has six or more options and the normal distribution assumption is met (Elosua Oliden & Zumbo, 2008). As a result, researchers underestimate or overestimate the true reliability of the measure; therefore, its use is not recommended (Ventura-León & Caycho-Rodríguez, 2017). Given this situation, it is methodologically correct to use reliability estimators according to the nature of the items, such as the omega coefficient (McDonald, 1999), which shows less bias in the assessment of reliability (Dunn et al., 2014), or the ordinal coefficient alpha (Elosua Oliden & Zumbo, 2008).
Given these antecedents, there are still doubts that still need to be clarified about the best factorial fit of the ERQ, as well as other psychometric properties such as reliability, for their correct use in social research and intervention, especially in the Latin American and Spanish-speaking population.
Objectives and Hypotheses
Based on the analysis contained in this text, the objectives of this study are a) to confirm the bifactor structure of the Emotion Regulation Questionnaire, comparing an orthogonal and an oblique two-factor model as well as a bifactor model with a general factor (see Figure 1) in a sample of Ecuadorian college students. It is hypothesized that the bifactor model is the model with the best fit; b) to estimate the internal consistency reliability of the ERQ model with the best fit. It is hypothesized that the ERQ has an optimal and adequate adjustment for Ecuadorian college students.
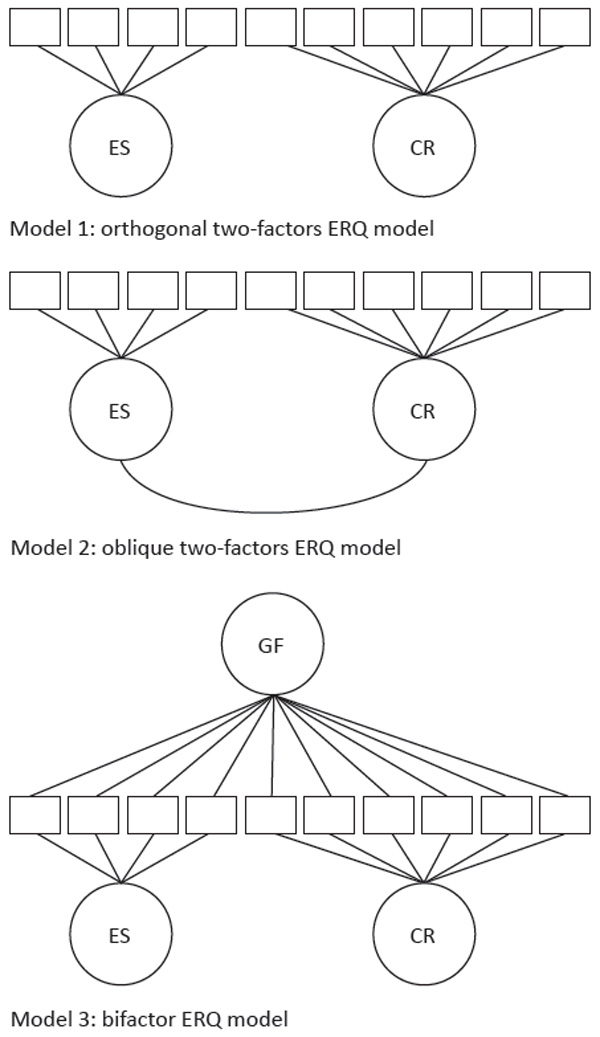
Figure 1. Different Models of the Emotion Regulation Questionnaire Evaluated in the Study
Method
This study applied a quantitative and instrumental descriptive design (Ato et al., 2013) to confirm the model of two correlated factors of the ERQ in a sample of Ecuadorian college students through appropriate statistical tests for ordinal variables.
Participants
Our sample included 400 college students, aged 18 to 25 years (M = 21.1 years; SD = 1.95), where 62.5% are women and 37.5% are men. In terms of ethnicity, most identified as mestizos (97.8%), while a few identified as white or indigenous (2.3%). In addition, 86% are located in urban areas and 14% in rural areas. Participants are students from two universities in Ambato, Ecuador; one public (62.5%) and one co-financed (37.5%), and from seven different undergraduate courses. Finally, 36.8% of the sample receive financial aid, and 3.1% present academic risk due to poor performance.
Participants were selected through a non-probabilistic convenience sampling with the following inclusion criteria: a) voluntary participation through a signed consent letter; b) enrollment and regular class attendance; and c) adequate mental health to carry out the psychological evaluation process.
Procedure
After permission was given by the authorities of the participating universities, the psychological evaluation began. All students interested in the research project were summoned to receive information about the objectives of the study and the activities they would perform. Before the general evaluation, a pilot test was carried out with 30 participants to learn details about the evaluation time and language adaptations that could be necessary for the items of the test.
Once in the global evaluation, participants signed a letter of consent before beginning the psychological assessment. After the evaluation, data was refined and digitized for subsequent statistical analysis and hypothesis verification. With the results achieved, the written report was prepared and approved.
Instrument
Emotion Regulation Questionnaire (ERQ; Gross & John, 2003) in its Spanish version (Rodríguez-Carvajal et al., 2006) and adapted to Ecuadorian college students (Moreta-Herrera et al., 2018). It has 10 items measured on a five-point Likert scale, ranging from strongly disagree (1) to strongly agree (7), in which Cognitive Reappraisal and Emotion Suppression strategies are measured.
Data Analysis
Data analysis was divided into three blocks. The first block corresponded to preliminary analysis, to learn the behavior of the variables using measures of central tendency, dispersion, and distribution. The univariate normality assumption was verified due to the values of skewness and kurtosis being within the parameter ±1.5 (Ferrando & Anguiano-Carrasco, 2010). Finally, the assumption of multivariate normality was checked through the Mardia test, where skewness and kurtosis were found to be not significant (p > .05) (Cain et al., 2017; Mardia, 1970).
The second block corresponded to the CFA with the RML estimator, which is reported as the most appropriate estimator considering the continuous nature of the variables and the absence of multivariate normality (Holtmann et al., 2016; Jin & Cao, 2018). Three models have been tested: a) an oblique two-factor model; b) an orthogonal two-factor model; and c) a bifactor model with two specific factors (SF) and a general factor (GF). The analysis verified that standardized factor loadings were λ > 0.5, which positively contributes to the explained variance (Hair et al., 2004). Different adjustment levels were also analyzed: a) absolute fit indices through the Chi-squared test (X2), normed Chi-square (X2/df), and the Standardized Root Mean Square Residual (SRMR); b) relative fit indices such as the Comparative Fit Index (CFI) and the Tucker-Lewis Index (TLI); and c) a non-centrality-based index through the Mean Square Error of Approximation (RMSEA). A model has an adequate adjustment when χ2 is not significant (p > .05) or χ 2/df is less than 4, CFI and TLI are greater than 0.9, and SRMR together with RMSEA are less than 0.08 (Brown, 2015; Byrne, 2008; Ferrando & Anguiano-Carrasco, 2010; Mueller & Hancock, 2018; Wolf et al., 2013). For the bifactor model, the Hierarchical Omega adjustments for the general factor (ωH), the specific factors (ωHs), and the Common Explained Variance (ECV) were also tested. The bifactor model presented an adequate adjustment with ωH > = .70, ECV > = .70, and the ωHs > = .30 (Reise et al., 2013; Rodríguez-Lara & Rodríguez, 2017; Rodriguez et al., 2016).
The third block included analysis of internal consistency of the ERQ using the omega coefficient (ω, McDonald, 1999; Ventura-León & Caycho-Rodríguez, 2017), together with the confidence intervals that ensure a better estimate of internal consistency (Domínguez-Lara & Merino-Soto, 2015). All data analyses were performed using R software (R Core Team, 2019), an open-access program.
Results
Preliminary Analysis
Table 1 shows that the item scores are generally concentrated in the middle of the response scale, displaying a moderate distribution. Univariate normality analysis shows that this assumption is fulfilled based on the fact that both skewness and kurtosis scores are within the normal range (±1.5); while the assumption of multivariate normality is not met since the Mardia test shows significance for both skewness and kurtosis.
Table 1
Preliminary Analysis of the ERQ Items
|
Item |
|
M |
SD |
Skew |
Kurt |
|
|
Cuando quiero incrementar mis emociones positivas (p.ej. alegría, diversión), cambio el tema sobre el que estoy pensando. |
When I want to feel more positive emotion (such as joy or amusement), I change what I’m thinking about |
4.84 |
1.65 |
-0.79 |
-0.14 |
|
|
Guardo mis emociones para mí mismo |
I keep my emotions to myself |
4.71 |
1.69 |
-0.61 |
-0.46 |
|
|
Cuando quiero reducir mis emociones negativas (p.ej. tristeza, enfado), cambio el tema sobre el que estoy pensando |
When I want to feel less negative emotion (such as sadness or anger), I change what I’m thinking about |
5.05 |
1.56 |
-0.74 |
-0.21 |
|
|
Cuando estoy sintiendo emociones positivas, tengo cuidado de no expresarlas |
When I am feeling positive emotions, I am careful not to express them |
3.58 |
1.71 |
0.12 |
-1.03 |
|
|
Cuando me enfrento a una situación estresante, intento pensar en ella de un modo que me ayude a mantener la calma |
When I’m faced with a stressful situation, I make myself think about it in a way that helps me stay calm |
4.85 |
1.67 |
-0.70 |
-0.40 |
|
|
Controlo mis emociones no expresándolas |
I control my emotions by not expressing them |
4.04 |
1.71 |
-0.12 |
-0.85 |
|
|
Cuando quiero incrementar mis emociones positivas, cambio mi manera de pensar sobre la situación |
When I want to feel more positive emotion, I change the way I’m thinking about the situation |
4.68 |
1.60 |
-0.65 |
-0.21 |
|
|
Controlo mis emociones cambiando mi forma de pensar sobre la situación en la que me encuentro |
I control my emotions by changing the way I think about the situation I’m in |
4.79 |
1.45 |
-0.52 |
-0.09 |
|
|
Cuando estoy sintiendo emociones negativas, me aseguro de no expresarlas |
When I am feeling negative emotions, I make sure not to express them |
4.39 |
1.62 |
-0.30 |
-0.60 |
|
|
Cuando quiero reducir mis emociones negativas, cambio mi manera de pensar sobre la situación |
When I want to feel less negative emotion, I change the way I’m thinking about the situation |
4.86 |
1.56 |
-0.67 |
-0.13 |
|
|
|
|
Mardia |
951.8*** |
29.2* |
|
|
Note. * p < .05; *** p < .001; M: sample mean; SD: standard deviation; Skew: skewness; Kurt: kurtosis
Confirmatory Factor Analysis
Table 2 shows the results of the fit indices of the three models of the ERQ evaluated in this study. The first model is the original one proposed by Gross & Jhon (2003); the second one is the oblique two-factor model; and the third corresponds to the bifactor model. Applying the MLR estimator, the oblique two-factor model (with a moderate latent correlation of ρ = .56) and the bifactor model of the ERQ presents an adequate adjustment as shown by absolute fit indices (χ 2, χ 2/df, SRMR), relative fit indices (CFI, TLI), and non-centrality-based index (RMSEA). The fit values for the bifactor model are better than those of the oblique two-factor model. The ANOVA function for SEM carried out by the Satorra-Bentler scaled Chi-square difference test (Satorra & Bentler, 2001) identifies the differences of adjustment of the Chi-squared and presents significant differences (p < .05) between the models, with ꭓ2(bifactor – oblique two-factor) = 59.26; df (bifactor – oblique two-factor) = 9; p <.001, so the bifactor model is a better fit than the oblique two-factor model.
Table 2
Confirmatory Factor Analysis of the ERQ with MLR Estimation
|
Models |
ꭓ2 |
df |
ꭓ2/df |
CFI |
TLI |
SRMR |
RMSEA |
|
Orthogonal two factors |
154.12*** |
35 |
4.40 |
.83 |
.79 |
.17 |
.09 [.08–.11] |
|
Oblique two factors |
99.45*** |
34 |
2.93 |
.91 |
.90 |
.06 |
.07 [.06–.08] |
|
Bifactor |
35.99 |
25 |
1.43 |
.98 |
.96 |
.03 |
.03 [.01–.05] |
Note. ꭓ2: Chi-squared test; df = degrees of freedom; χ2/df: normed Chi-square; CFI: Comparative Fit Index; TLI: Tucker-Lewis Index; SRMR: Standardized Mean Square Residue; RMSEA: Mean Square Error of Approximation
Regarding the CFA of the ERQ, factor loadings of the bifactor model were tested. Figure 2 shows that the behavior of standardized factor loadings (λ) through the general factor is more consistent than through the specific factors of the ERQ; therefore, the general factor presents a better explained variance than the specific factors. This is confirmed with better adjustment of the ωH and moderate adjustment of the ECV and PUC for the general factor when compared to the specific factors.
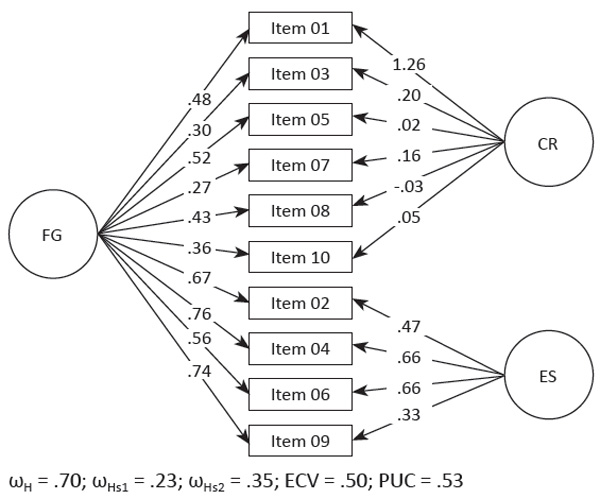
Figure 2. Bifactor Model of the Emotion Regulation Questionnaire
Note: Circles represent the latent variables that comprise errors and factors (Cognitive Reappraisal and Emotion Suppression), while rectangles represent the observed variables that are the test items
Reliability Analysis
Table 3 presents the omega coefficient (ω) values with their respective confidence interval of each of the ERQ factors, which report an acceptable degree of internal consistency; this is evidence that the ERQ is a reliable instrument for Ecuadorian college students. Furthermore, the intercorrelations of the ERQ factors with their overall score show that the factors have moderate and high levels of correlation, so it is estimated that they contribute significantly to the model.
Table 3
Analysis of Reliability and Intercorrelations of the ERQ|
Factor |
ω CI 95% |
CR |
ES |
ERQ |
|
Cognitive Reappraisal |
.85 [.83–.87] |
1 |
.303** |
.713** |
|
Emotion Suppression |
.75 [.71–.79] |
|
1 |
.624** |
|
Global |
.86 [.84–.88] |
|
|
1 |
Note. ** p < .01; ω: McDonald´s omega coefficient; CR: Cognitive Reappraisal; ES: Emotion Suppression; ERQ: Emotion Regulation Questionnaire
Discussion
The objectives of this study were to identify the best adjust model of the ERQ, as well as its reliability in a sample of Ecuadorian college students. Regarding the CFA procedure, given the absence of multivariate normality and the continuous distribution of the observed variables (see Table 1), the use of a robust estimator was necessary (Gitta & Bengt, 2009; Holtmann et al., 2016). Robust Maximum Likelihood estimation (MLR) was chosen, since this method presents the best results in the cases indicated for its use (Li, 2016). In addition, the use of MLR is justified not only in the preliminary criteria to the CFA, but also due to its recent use in similar validation processes of the ERQ (Preece et al., 2020).
CFA with MLR estimation found that the oblique two-factor and the bifactor models are optimum and consistent. Absolute Fit Indices (χ2, χ2/df and SRMR), Relative Fit Indices (CFI, TLI), and the non-centrality-based index (RMSEA) (Brown, 2015; Byrne, 2008; Ferrando & Anguiano-Carrasco, 2010; Mueller & Hancock, 2018; Wolf et al., 2013) reflect adequate values. This confirms the good fit of the ERQ for Ecuadorian college students. The results presented in this study are consistent with those presented previously (Enebrink et al., 2013; Gargurevich & Matos, 2010; Moreta-Herrera et al., 2018; Preece et al., 2020), and differ from the orthogonal two-factor model proposed by Gross & Jhon (2003) and from other similar validation studies (Abler & Kessler, 2009; Balzarotti et al., 2010; Cabello et al., 2013; Preece et al., 2021; Rodríguez-Carvajal et al., 2006; Spaapen et al., 2014; Teixeira et al., 2015), since the orthogonal two-factor model did not present a relevant fit.
Likewise, there is a latent interfactorial correlation in the oblique model (ρ), which allows exploring a new multidimensional model through a bifactor model, which encompasses all its items in a general factor, while respecting the uniqueness of the specific factors (Stefansson et al., 2016). This model has better factorial configuration settings (Reise et al., 2013; Rodriguez et al., 2016; Rodríguez-Lara & Rodríguez, 2017) and differs significantly from the previous model (X2(bifactor – oblique two-factors) = 59.26; df(bifactor – oblique two-factors) = 9; p < .001); consequently, its use is recommended. This is relevant in psychometric research because it proposes a multidimensional model of which there are no previous reports. This will allow in the future new processes of normalization of the scores considering the global result of the test, which was previously inadequate, and reveals an unexplored composition of this assessment tool that maximizes the interpretation of the construct Emotion Regulation. However, since these findings do not yet have supporting evidence, they should be viewed with caution pending future confirmatory studies.
Regarding reliability, it was found that both McDonald’s coefficient scores and their confidence intervals (CI) are within accepted parameters (Domínguez-Lara & Merino-Soto, 2015; Ventura-León & Caycho-Rodríguez, 2017), with both of the internal components (Cognitive Reappraisal and Emotion Suppression) and with the global assessment. In the context of Ecuador, these results (CFA and reliability) share similar conclusions to those of previous research of Moreta-Herrera et al. (2018) with psychology students. However, due to the modification of the methodology, it is necessary to be cautious with future comparisons because there are no similar studies that serve as a reference.
Conclusion
Both CFA with RML estimation and reliability through McDonald’s coefficient (1999) of the ERQ bifactor model show adequate validation results. Thus, there is sufficient evidence of validity (Elosua, 2003) for the use of the ERQ in research and diagnosis in samples of Ecuadorian college students. Given the methodological variants used at the time of this analysis, new confirmatory studies are required to verify the factorial structure of the ERQ in other contexts.
Within the implications of the present study for instrumental research, the gate is open for the strengthening of this line of research in Ecuador and the region. An updated methodological framework is offered, and its use is recommended for validation processes of psychological tests. Three innovations are presented: a) CFA with a robust method (MLR); b) the omega coefficient (ω) for internal consistency with the confidence intervals; and c) a new factor configuration of the scale. The first two are recommended for an adequate analysis for continuous variables that do not present normal distribution, and the third one to improve the assessment of the real reliability of a test. Finally, the results obtained in the ERQ analysis allow us to confirm that it shows good validity in terms of factorial structure and high reliability.
Limitations
One of the main limitations of this study is related to the lack of other validation processes such as convergent and discriminant validity, which were not carried out due to limitations inherent to the study, since no information was collected that would allow this process. For future research, it is recommended to take this aspect into account for more in-depth studies. This study only analyzes the factorial validity of the ERQ test, but not the measurement invariance for multigroup studies (culture, sex, age groups, and others). Therefore, this should be considered and confirmed in advance as a preliminary step for comparative studies. Finally, only students from two universities in Ecuador were considered; therefore, we recommend replicating this study with other types of populations such as adolescents, the general population, and others.
Acknowledgments
This research was supported by Pontificia Universidad Católica del Ecuador Sede Ambato.
Ethics Statement
All procedures performed in studies involving human participants followed the ethical standards of the Pontificia Universidad Católica del Ecuador Sede Ambato research committee and the 1964 Helsinki Declaration and its later amendments, or comparable ethical standards.
Author Contributions
Rodrigo Moreta-Herrera, Mónica Perdomo-Pérez, and Diego Vaca-Quintana oversaw the bibliographic search and the formulation of the introduction; Hernán Sánchez-Vélez, Pamela Camacho-Bonilla, and Fabricio Vásquez de la Bandera performed the data collection and introduction and methodology; Rodrigo Moreta-Herrera, Sergio Domínguez-Lara, and Tomás Caycho-Rodríguez performed the statistical management, the results, and the formulation of the discussion. All authors reviewed the final version of the text and gave their consent and approval.
Conflict of Interest
The authors declare no conflict of interest.
References
Abler, B., & Kessler, H. (2009). Emotion Regulation Questionnaire - A German version of Gross & John's ERQ. Diagnostica, 55(3), 144-152. https://doi.org/10.1026/0012-1924.55.3.144
Aldao, A., Nolen-Hoeksema, S., & Schweizer, S. (2010). Emotion-regulation strategies across psychopathology: А meta-analytic review. Clin. Psychol. Rev., 30, 217-237. https://doi.org/10.1016/j.cpr.2009.11.004
Ato, M., López, J., & Benavente, A. (2013). Un sistema de clasificación de los diseños de investigación en psicología. Anales de Psicología, 29(3), 1038-1059. https://doi.org/10.6018/analesps.29.3.178511
Balzarotti, S., John, O. P., & Gross, J. J. (2010). An Italian adaptation of the Emotion Regulation Questionnaire. European Journal of Psychological Assessment, 26(1), 61-67. https://doi.org/10.1027/1015-5759/a000009
Boomsma, A., & Hoogland, J. (2001). The robustness of LISREL modeling revisited. In R. Cudeck, S. Du Toit, & D. Sörbom (Eds.), Structural equation modeling: Present and future. A festschrift in honor of Karl Jöreskog (pp. 139-168). Scientific Software International.
Brown, T. A. (2015). Confirmatory factor analysis for applied research (Vol. 2). Guilford Publications.
Byrne, B. (2008). Testing for multigroup equivalence of a measuring instrument: A walk through the process. Psicothema, 20(4), 872-882.
Cabello, R., Salguero, J. M., Fernández-Berrocal, P., & Gross, J. (2013). A Spanish adaptation of the emotion regulation questionnaire. European Journal of Psychological Assessment, 29(4), 234-240. https://doi.org/10.1027/1015-5759/a000150
Cain, M. K., Zhang, Z., & Yuan, K. H. (2017). Univariate and multivariate skewness and kurtosis for measuring nonnormality: Prevalence, influence and estimation. Behavior Research Methods, 49(5), 1716-1735. https://doi.org/10.3758/s13428-016-0814-1
Caycho-Rodríguez, T., Valencia, P. D., Vilca, L. W., Cervigni, M., Gallegos, M., Martino, P., … Burgos Videla, C. (2021). Cross-cultural measurement invariance of the fear of COVID-19 scale in seven Latin American countries. Death Studies. https://doi.org/10.1080/07481187.2021.1879318
Domínguez-Lara, S. A., & Merino-Soto, C. (2015). ¿Por qué es importante reportar los intervalos de confianza del coeficiente alfa de Cronbach? RLCSNJ, 13(2), 1326-1328.
Dominguez-Lara, S., & Rodriguez, A. (2017). Índices estadísticos de modelos bifactor. Interacciones, 3(2), 59-65. https://doi.org/10.24016/2017.v3n2.51
Dunn, T. J., Baguley, T., & Brunsden, V. (2014). From alpha to omega: A practical solution to the pervasive problem of internal consistency estimation. British Journal of Psychology, 105, 399-412. https://doi.org/10.1111/bjop.12046
Elosua Oliden, P., & Zumbo, B. D. (2008). Coeficientes de fiabilidad para escalas de respuesta categórica ordenada. Psicothema, 20(4), 896-902.
Elosua, P. (2003). Sobre la validez de los tests. Psicothema, 15(2), 315-321.
Enebrink, P., Björnsdotter, A., & Ghaderi, A. (2013). The Emotion Regulation Questionnaire: Psychometric properties and norms for Swedish parents of children aged 10-13 years. Europe's Journal of Psychology, 9(2), 289-303. https://doi.org/10.5964/ejop.v9i2.535
Ferrando, P. J., & Anguiano-Carrasco, C. (2010). El análisis factorial como técnica de investigación en psicología. Papeles del Psicólogo, 31(1), 18-33.
Gargurevich, R., & Matos, L. (2010). Propiedades psicométricas del Cuestionario de Regulación Emocional adaptado para el Perú (ERQP). Revista de Psicología, 12, 192-215.
Gitta, H., & Bengt, O. M. (2009). Applying multigroup confirmatory factor models for continuous outcomes to Likert scale data complicates meaningful group comparisons. Structural Equation Modeling: A Multidisciplinary Journal, 11(4), 514-534. https://doi.org/10.1207/s15328007sem1104_2
Gross, J. (1999). Emotion regulation: past, present, future. Cognition and Emotion, 13, 551-573. https://doi.org/10.1080/026999399379186
Gross, J. J. (2007). Handbook of Emotion Regulation. Guilford.
Gross, J. J., & John, O. P. (2003). Individual differences in two emotion regulation processes: Implications for affect, relationships, and well-being. Journal of Personality and Social Psychology (85), 348-362. https://doi.org/10.1037/0022-3514.85.2.348
Hair, J. F., Anderson, R. E., Tatham, R. L., & Black, W. C. (2004). Análisis multivariante. Prentice Hall.
Holtmann, J., Koch, T., Lochner, K., & Eid, M. (2016). A comparison of ML, WLSMV, and Bayesian methods for multilevel structural equation models in small samples: A simulation study. Multivariate Behavioral Research, 51(5), 661-680. https://doi.org/10.1080/00273171.2016.1208074
Jin, S., & Cao, C. (2018). Selecting polychoric instrumental variables in confirmatory factor analysis: An alternative specification test and effects of instrumental variables. British Journal of Mathematical and Statistical Psychology, 71(2), 387-413. https://doi.org/10.1111/bmsp.12128
Jonason, P., Zemojtel-Piotrowska, M., Piotrowski, J., Sedikides, C., Campbell, K., Gebauer, J., … Yahiiaev, I. (2020). Country‐level correlates of the dark triad traits in 49 countries. Journal of Personality, 88(6), 1252-1267.https://doi.org/10.1111/jopy.12569
Li, C. H. (2016). Confirmatory factor analysis with ordinal data: Comparing robust maximum likelihood and diagonally weighted least squares. Behavior Research Methods, 48(3), 936-949. https://doi.org/10.3758/s13428-015-0619-7
Mardia, K. (1970). Measures of multivariate skewness and kurtosis with applications. Biometrika (57), 519.https://doi.org/10.2307/2334770
McDonald, R. P. (1999). Test theory: A unified treatment. Lawrence Erlbaum Associates, Inc.
Momeñe, J., Jauregui, P., & Estevez, A. (2017). El papel predictor del abuso psicológico y la regulación emocional en la dependencia emocional. Psicologia conductual, 25(1), 65-78.
Moreta-Herrera, R., Domínguez-Lara, S., Sánchez-Guevara, S., López-Castro, J., & Molina-Narváez, M. (2021a). Análisis multigrupo por sexo y fiabilidad del Cuestionario de Regulación Emocional (ERQ) en jóvenes ecuatorianos. Avaliação Psicológica, 20(2), 220-228. https://doi.org/10.15689/ap.2021.2002.19889.10
Moreta-Herrera, R., Durán-Rodríguez, T., & Gaibor-González, I. (2018). Estructura factorial y fiabilidad del Cuestionario de Regulación Emocional (ERQ) en una muestra de estudiantes del Ecuador. Revista Latinoamericana de Ciencia Psicológica, 10(2). https://doi.org/10.5872/psiencia/10.2.24
Moreta-Herrera, R., Lara-Salazar, M., Camacho-Bomilla, P., & Sánchez-Guevara, S. (2019). Análisis factorial, fiabilidad y validez de la escala de autoeficacia general (EAG) en estudiantes ecuatorianos. Psychology, Society, & Education, 11(2), 193-204. https://doi.org/10.25115/psye.v11i2.2024
Moreta-Herrera, R., Rodas, J., & Lara-Salazar, M. (2021b). Factor validity of Alcohol Use Disorders Identification Test (AUDIT) using robust estimations in Ecuadorian adolescents. Alcohol & Alcoholism, 56(4), 482-489. https://doi.org/10.1093/alcalc/agaa126
Mueller, R. O., & Hancock, G. R. (2018). Structural equation modeling. In G. Hancock, L. Stapleton, & R. Mueller, The reviewer's guide to quantitative methods in the social sciences (pp. 445-456). Routledge. https://doi.org/10.4324/9781315755649-33
Myung, I. J. (2003). Tutorial on maximum likelihood estimation. Journal of Mathematical Psychology, 47(1), 90-100. https://doi.org/10.1016/S0022-2496(02)00028-7
Preece, D. A., Becerra, R., Hasking, P., McEvoy, P. M., Boyes, M., Sauer-Zavala, S., … Gross, J.J. (2021). The Emotion Regulation Questionnaire: Psychometric properties and relations with affective symptoms in a United States general community sample. Journal of Affective Disorders, 284, 27-30. https://doi.org/10.1016/j.jad.2021.01.071
Preece, D., Becerra, R., Robinson, K., & Gross, J. (2020). The Emotion Regulation Questionnaire: Psychometric properties in general community samples. Journal of Personality Assessment, 102(3), 348-356. https://doi.org/10.1080/00223891.2018.1564319
R Core Team. (2019). R: A language and environment for statistical computing. R Foundation for Statistical Computing.
Reise, S., Scheines, R., Widaman, K., & Haviland, M. (2013). Multidimensionality and structural coefficient bias in structural equation modeling: A bifactor perspective. Educational and Psychological Measurement, 73(1), 5-26. https://doi.org/10.1177/0013164412449831
Rodriguez, A., Reise, S., & Haviland, M. (2016). Evaluating bifactor models: Calculating and interpreting statistical indices. Psychological Methods, 21(2), 137-150. https://doi.org/10.1037/met0000045
Rodríguez-Carvajal, R., Moreno-Jiménez, B., & Garrosa, E. (2006). Cuestionario de Regulación Emocional.Versión española. Universidad Autónoma de Madrid.
Rönkkö, M., McIntosh, C. N., & Antonakis, J. (2015). On the adoption of partial least squares in psychological research: Caveat emptor. Personality and Individual Differences, 87, 76-84. https://doi.org/10.1016/j.paid.2015.07.019
Satorra, A., & Bentler, P. (2001). A scaled difference chi-square test statistic for moment structure analysis. Psychometrika, 66, 507-514. https://doi.org/10.1007/BF02296192
Sijtsma, K. (2009). On the use, the misuse, and the very limited usefulness of Cronbach's alpha. Psychometrika, 74, 107-120. https://doi.org/10.1007/s11336-008-9101-0
Spaapen, D., Waters, F., Brummer, L., Stopa, L., & Bucks, R. (2014). The Emotion Regulation Questionnaire: Validation of the ERQ-9 in two community samples. Psychological Assessment, 26(1), 46-54. https://doi.org/10.1037/a0034474
Stefansson, K. K., Gestsdottir, S., Geldhof, G. J., Skulason, S., & Lerner, R. M. (2016). A bifactor model of school engagement: Assessing general and specific aspects of behavioral, emotional and cognitive engagement among adolescents. International Journal of Behavioral Development, 40(5), 471-480. https://doi.org/10.1177/0165025415604056
Sullivan, G. M., & Artino, A. R. (2013). Analyzing and interpreting data from Likert-type scales. Journal of Graduate Medical Education, 5(4), 541-542. https://doi.org/10.4300/JGME-5-4-18
Teixeira, A., Silva, E., Tavares, D., & Freire, T. (2015). Portuguese validation of the Emotion Regulation Questionnaire for Children and Adolescents (ERQ-CA): Relations with self-esteem and life satisfaction. Child Indicators Research, 8(3), 605-621. https://doi.org/10.1007/s12187-014-9266-2
Trizano-Hermosilla, I., & Alvarado, J. M. (2016). Best alternatives to Cronbach's alpha reliability in realistic conditions: Congeneric and asymmetrical measurements. Frontiers in Psychology, 7, 769. https://doi.org/10.3389/fpsyg.2016.00769
Ventura-León, J., & Caycho-Rodríguez, T. (2017). El coeficiente Omega: un método alternativo para la estimación de la confiabilidad. Revista Latinoamericana de Ciencias Sociales, Niñez y Juventud, 15(1), 625-627.
Wolf, E. J., Harrington, K. M., Clark, S. L., & Miller, M. W. (2013). Sample size requirements for structural equation models: An evaluation of power, bias, and solution propriety. Educational and Psychological Measurement, 73(6), 913-934. https://doi.org/10.1177/0013164413495237
Zumba-Tello, D., & Moreta-Herrera, R. (2022). Afectividad, Regulación Emocional, estrés y salud mental en adolescentes del Ecuador en tiempos de pandemia. Revista de Psicología de la Salud UHM, 10(1), 117-129. https://doi.org/10.21134/pssa.v10i1.801
To cite this article: Moreta-Herrera, R., Perdomo-Pérez, M., Vaca-Quintana, D., Sánchez-Vélez, H., Camacho-Bonilla, P., Vásquez de la Bandera, F., Dominguez-Lara, S., Caycho-Rodríguez, T. (2022). New Psychometric Evidence of a Bifactor Structure of the Emotional Regulation Questionnaire (ERQ) in Ecuadorian College Students. Psychology in Russia: State of the Art, 15(1), 120–134. DOI: 10.11621/pir.2022.0108
The journal content is licensed with CC BY-NC “Attribution-NonCommercial” Creative Commons license.


