Diagnosing Human Psychoemotional States by Combining Psychological and Psychophysiological Methods with Measurements of Infrared and THz Radiation from Face Areas
Adamovich, T.V.  Psychological Institute of the Russian Academy of Education, Moscow, Russia
Abstract
Background. One promising direction in development of contactless techniques for assessment of the human psychoemotional state (PES) is elucidation of the relationships between psychophysiological indices and electromagnetic radiation in the IR and THz ranges.
Objective. To present a complex approach to assessing PESs based on combining psychological testing and psychophysiological diagnostics with measurements of radiation in the IR-THz range from face areas.
Methods. Stressful psychoemotional states were provoked by physical or cognitive stressors. The PES was monitored by psychological testing and registration of heart rate, photoplethysmogram, galvanic skin response, and respiration rate. The facial images in the IR-THz range were extracted by an IR/V-T0831Cdetector (NEC, Japan).
Results and Discussion. Different PESs are characterized by different specific patterns of psychophysiological parameters. Scores on the anxiety test are highly correlated with scores on the chronic stress questionnaire, but there are no reliable links between the data of psychological tests and the psychophysiological indicators. This discrepancy allows us to assume that for reliable identification of PESs, it is necessary to combine these technologies into one diagnostic complex. We found statistically significant correlations between the intensity of the IR-THz image in the forehead and the galvanic skin response.
Conclusion. For the effective diagnosis and forecast of changes in the PES, it is important to consider both the psychological and physiological data. Despite the relatively low signal-to-noise ratio and low frequency of image recording, it is possible to extract informative THz parameters of the broadband IR-THz signal and associate them with psychophysiological reactions. The improvement of IR-THz detectors and the development of new processing methods will allow wide use of the THz range for remote assessment of human PESs in real time.
Received: 14.05.2019
Accepted: 24.02.2020
PDF: http://psychologyinrussia.com/volumes/pdf/2020_2/Psychology_2_2020_64-83_Berlovskaya.pdf
Pages: 64-83
DOI: 10.11621/pir.2020.0205
Keywords: psychoemotional (stressful) states; psychophysiological diagnosis; psychological testing; instrumental contactless psychodiagnostics; infrared radiation; terahertz waves
Introduction. Problem Statement
The development of modern technologies for diagnosis of a person’s psychoemotional state (PES) (emotions, stress, anxiety, etc.) has been characterized by the transition from contact methods to remote ones (bio radar, laser Doppler vibrometry, eye tracking, audio and video recording, etc.), which allow PESs to be assessed in real time without contacting the object under study (Chernorizov et al., 2016).
One promising area is analysis of the relationship between the objective (psychophysiological) indicators of PESs and a person’s own electromagnetic radiation in the infrared (IR) range (Cardone & Merla, 2017; Cardone, Pinti, & Merla, 2015; Hong & Hong, 2016; Ioannou, Gallese, & Merla, 2014; Pavlidis & Levine, 2001; Puri, Olson, Pavlidis, Levine & Starren, 2005). Changes in PES cause changes in the reflection coefficient of the skin surface, which is an objective diagnostic criterion (Kudryashov, Perov, & Rubin, 2008). Most of the natural radiation from the surface of human skin lies in the IR range and corresponds to wavelengths from 4 to 50 μm, while its maximum falls on waves with l= 10 μm (Bowling Barnes, 1963). Functional infrared thermal imaging (fITI) is today considered an upcoming, promising methodology in the diagnostics of PESs. Changes in local temperature associated with the activity of the facial muscles involved in the expression of emotions can be measured remotely using an IR digital camera (Kosonogov, 2017). This allows non-contact recording of a set of stereotyped patterns of facial muscle activity and, thus, recognizing the emotions associated with these patterns. Several studies have confirmed a clear correlation between emotions, stress levels, pain, and anxiety, on the one hand, and changes in blood flow in the facial skin, on the other (Cardone & Merla, 2017; Ioannou et al., 2014).
The development of the terahertz (THz) imaging technique (Tera =1012, 1 THz =1×10¹²Hz) in recent years has raised the question of whether human radiation in this frequency range provides additional information. The main purpose of the THz technology of wavelength range vision systems is to provide remote real-time image acquisition. Two main approaches are used to get a THz image of an object: passive and active visualization. Active visualization is based on the illumination of the object by an external source of THz radiation. Even though THz waves are non-ionizing, this does not mean they are fully safe for human beings. The mechanism of interaction of THz waves with biological systems suggests that intense THz pulses can cause significant non-thermal biological effects (Hough et al., 2018; Huntzsche & Stopper, 2012). However, even low-intensity radiation can cause various bioeffects (Pakhomov, Akyel, Pakhomova, Stuck, & Murphy, 1998). In passive imaging, the THz image is extracted from the thermal radiation emitted by the body of persons or objects being inspected.
It is expected that expanding the IR range to the THz frequency range should lead to informative contributions determined by such physiological indicators as peripheral blood circulation and sweating, and related changes in the refractive index of the skin and its transmittance. This should allow recording of changes in the psychological state of people by recording their physiological parameters. The THz range occupies an intermediate position between the optical and radio bands, and in the wavelength scale it is defined as a range from 30 to 1,000 microns (Lee, 2009). In high frequencies, the THz range overlaps with the far IR range, and at low frequencies with the microwave range (Angeluz et al., 2014). THz radiation has several unique features (high sensitivity, resolution, reliability), which are used in applied research for the development of diagnostic systems for THz tomography in medicine, biology, pharmacy, and the food industry (Smolyanskaya et al., 2018; Sun et al., 2017; Yang et al., 2016; Zhang & Xu, 2010).
In our previous work (Berlovskaya et al., 2019) we proposed a new approach to the THz diagnostics of human PESs, based on analysis of the THz contribution to the total signal, while simultaneously recording IR and THz emissions (IR-THz image) from a subject’s face in situations of physical stress (short, intense physical exercise: functional squat test), emotional stress (weak electrical stimulation), and information stress (cognitive load: simple mental arithmetic calculations). The data were compared with those of similar measurements at rest. The IR-THz image processing algorithm we developed allowed extraction of the informative contribution determined by the THz radiation, from the total signal perceived by the recording system. We showed that by using cluster analysis of IR-THz images, it is possible to divide the test subjects into classes according to the reaction of the circulatory system under stressful conditions: In some people stress enhances the blood flow, while in others it causes vasospasm and, as a result, a decrease in the intensity of blood circulation. These data are in good agreement with Lawler's (1980) data on two different – sympathetic and parasympathetic – types of responses in stressful situations, and Friedman & Rosenman's (1959) data on the tight correlations of the risk of cardiovascular disorders in personality types “A” and "B".
The purpose of the present work is to develop a complex approach to diagnosis of PESs by combining psychological and psychophysiological data with physical measurements based on correlations between an IR-THz image of a subject’s face and the galvanic skin response. The study was part of an interdisciplinary approach to the diagnosis of human PESs, based on the analysis of a combination of physiological, psychological and behavioral data (Chernorizov et al., 2016; Isaychev et al., 2012; Lebedev, Isaychev, Chernorizov, & Zinchenko, 2013; ). One of the important tasks of this and our previous work (Berlovskaya et al., 2019) has been to search for the possibility to incorporate the data of physical measurements of human electromagnetic fields into the integral psychophysiological assessment of PESs. In accordance with this task, the experiments included registration of physiological parameters of PESs and, in parallel, the IR-THz radiation from volunteers’ faces in different stressful situations (tasks with cognitive, physical, or physiological loading). The results of the IR-THz radiation analysis were used selectively to find the correlation of the parameters of IR-THz images with the data of measurements of such informative indicators of PES as galvanic skin response.
Methods
Main Goal and General Design of the Experiments
The main goal of the work was to supplement the psychophysiological assessment of PESs with data of the physical measurements of human passive electromagnetic fields in the extended IR-THz range. Accordingly, the experiments included simultaneous registration of physiological parameters of PESs and IR-THz radiation of volunteers in stressful situations with cognitive, physical, or physiological loading. Based on physiological measurements and psychological testing, a comprehensive psychophysiological assessment of the subjects’ PESs was performed. Analysis of the IR-THz radiation captured from the participants faces was used to find the correlation of the parameters of IR-THz images with measurements of the galvanic skin response.
Participants
Thirty-two volunteer students (ages 17–24, mean age 20.8, SD = 5.53, 17 females) participated in the experiments. All gave written informed consent to the conditions of the experiment.
Methods of Stimulation and Registration
Psychological Testing
Before the experiments, the Spielberger State-Trait Anxiety Inventory, adapted into Russian by Khanin (Batarshev, 2005) and the Leonova questionnaire (Leonova, 2016; Vodopyanova, 2009) were used to determine the individual level of state anxiety (degree of anxiety at the time of experiment)/trait anxiety (anxiety as a personal characteristic) and the degree of chronic stress, respectively.
Psychophysiological Stimulation and Registration
Traditional functional trials (FTs) were used to provoke changes in PES (Ioannou et al., 2014): 1) FT with physical loading, FTP: 5-minute intensive exercises on a stationary bike-ergometer; 2) FT with emotional loading, FTE: electro-skin stimulation by a current of 17–20 mA with an interstimulus interval of 26–34 sec or, in a special series, the presentation of sharp, unpleasant, loud screams; 3) FT with cognitive loading, FTC (mental multiplication of two-digit numbers).
Each FT was preceded by registration of psychophysiological indicators in a state of quiet wakefulness (background, BG). The duration of a single FT was 3 minutes. Before each test, the 10-second instruction was given. The time interval between FTs was 30 seconds in order to reduce the effect of previous stimulation. The entire experiment with a single subject took 17 minutes.
To generate stressors and register established physiological stress markers (heart rate, HR; galvanic skin response, GSR; photoplethysmogram, PPG; respiration rate, RR) the following experimental setup was used:
-
Encephalan-EEGR-19/26 portable telemetric EEG-recorder (Medicom-MTD, Russia).
-
Egoskop software package (version 3.3.2, developed by Medicom-MTD, Russia) (Egoskop, 2019).
-
A seat for the subject with the possibility of comfortable head placement and with a backrest drive.
We used the length of the GSR line as the main indicator of episodic stress. This indicator includes both the tonic and phasic components of GSR. The tonic component reflects the protracted changes of the human functional state in minutes and hours. The phasic components, which mainly contribute to the GSR, reflect short-term changes in response to stimulation (from 1.5 to 10 sec). Thirty seconds was enough to restore the initial background level, from which the next portion of phasic components of the GSR to the stressor stimulus was calculated.
Measurement of IR-THz Images
Registration of IR-THz images was carried out using a 320×240-pixel microbolometer-based NEC IR/V-T0831C camera with the macro lens NEC IR/V-TL028. We did not use any filters, so the sensitivity of this camera system was in a spectral range from 1 to 30 THz (Terahertz Imager, 2019). The minimal detectable power (MDP) of this camera without a filter was about 100 pW at 1 THz and about 30…50 pW at 4 THz (NEC, 2014). The MDP at shorter wavelengths down to 10 um was in the same order of magnitude (Oda, 2012). That means the detection system’s sensitivitywas almost constant over the wide spectral range from infrared to terahertz. The typical range of sensitivity of high-performance thermal imaging cameras is limited by 7…14 um (FLIR, 2020). Therefore, the range of sensitivity of the camera used in our study and of any thermal infrared imaging camera system are only slightly overlapping. This is very important, because our detection system is significantly different from those used in earlier studies(e.g., Puri et al., 2005; Znamenskaya, Koroteeva, Isaychev, & Chernorizov, 2018).
In the process of recording and analyzing IR-THz images, we found that involuntary head movements associated with the stabilization of the body in space have a noticeable effect on the results of image processing. In order to minimize this, all subjects were positioned in a chair in a reclining position, with a headrest (Berlovskaya et al., 2019).
In view of our previously obtained data, the frontal and periorbital areas of the face were chosen as zones of interest (ZI) for analysis of IR-THz images (Berlovskaya et al., 2019).
Research Procedures
Experimental Procedure
The first (preliminary) stage included (1) questioning of the subjects to fill in the consent form for participation in the experiment, (2) psychological diagnosis of state/trait anxiety (STAI-K test) and chronic stress (Leonova questionnaire), (3) measurement of blood pressure and heart rate. The goal of this stage was to obtain information about the psychological and physiological state of the subjects, which might have an impact on their PESs in the functional trial.
The second (basic) stage included synchronous registration of passive electromagnetic radiation from the person tested in the IR-THz range and of psychophysiological indicators (ECG, PPG, GSR, RR) during the process of modelling stressful situations (FTP, FTE, FTC). The goal of this stage was to identify specific patterns of psychophysiological reactions and of passive electromagnetic radiation from the person tested in the IR-THz range, which can be used to diagnose PES changes under the influence of various stressors.
The values of all indicators recorded in the FT were then compared to the values of the same indicators obtained at rest (background state, BG).
Special Analysis of Psychological Testing Data
The level of state/trait anxiety and the severity of chronic stress of the subjects were assessed according to the scales prescribed by the tests of STAI-K and A.B. Leonova, respectively (Batarshev, 2005; Vodopyanova, 2009; Leonova, 2016). In particular, according to the STAI-K scale, subjects who scored 0–30 points, 31–45 points, or 46 and more points, are referred to groups with low, moderate, and high anxiety, respectively.
Special Analysis of Psychophysiological Data
During FT implementation, the following psychophysiological indicators were recorded and then analyzed:
-
heart rate (HR), determined by ECG, which was recorded using electrodes on the subject's forearms (cut-off frequency of low and high frequency filters – 0.5 Hz and 70 Hz, respectively; rejection filter – 50 Hz);
-
respiratory rate (RR), defined as the number of “inhale-exhale” cycles per minute;
-
amplitude of the systolic wave of PPG (ASW) used to assess the peripheral blood flow and the tone of resistive vessels (cut-off frequency of low and high frequency filters – 0.5 Hz and 10 Hz, respectively);
-
Kerdo index (IK) (Kerdö, 1966): IK = 100 × (1 – DBP / pulse), where DBP is the diastolic blood pressure (mm Hg); pulse rate (beats per minute); at IK > 0, sympathetic influences dominate in the activity of the vegetative nervous system (VNS), parasympathetic influences dominate at IK < 0, functional balance between sympathetic and parasympathetic divisions of the VNS is observed at IK = 0 (Minvaleev et al., 2018);
-
the normalized length of the line, the envelope of the GSR profile (GSRl), which was recorded by the Fere method (the frequency of the probe current is 140 ± 14 Hz, and the amplitude is not more than 0.15 μA). The GSRl was calculated as the sum of the absolute differences between adjacent GSR amplitudes measured at the sampling rate of 250 Hz: The sampling period (SP) equals 1 sec / 250 = 0.004 sec, or 4 ms). For example, the sum of the differences, the number of amplitude counts, and the time of the analyzed GSR are 0.66, 6, and 27.5 sec (6 × 4 = 24 ms, or 0.024 sec), respectively. Then the normalized value GSRl = 0.66 / 0.024 = 27.5. Thus, the GSRl is proportional to the amplitude and frequency of the signal, namely, the more time-varying the GSR signal, the greater the GSRl.
Special Analysis of IR-THz Images
1. First step of analysis
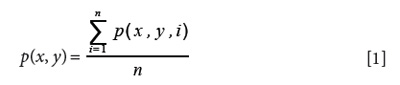
Within the selected resulting zone of interest (ZI) for a series of images taken in a calm state (background state, BS), the average value of each pixel of the analysis area is calculated:
2. Second step of analysis
For an array of images obtained in the FT, a list of image numbers is generated which correspond to the maximum values of synchronously recorded GSRs. Further, within the ±2 seconds interval with respect to each GSR peak mark, averaging is performed in the subject’s forehead for the same area of images obtained during this time interval. Thus, a surface is formed of average ratings for a stressful (FT) or calm background state (BS). The average value for the pixels of the area of these images is determined as follows:
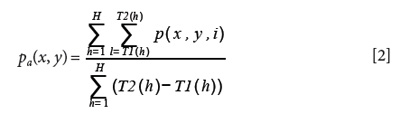
where: T1 is an array of lower limits of averaging intervals; T2is an array of upper bounds of averaging intervals; His the number of averaging intervals. T1and T2arrays are defined as:
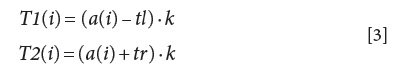
where: ais an array of GSR maximum time stamps; a(i) is the i-th time stamp; kis the number of recorded images per second (for a given archive, k = 8); tlis the start time of the averaging interval in the vicinity of the maximum; tris the end time of the averaging interval in the vicinity of the maximum.
3. Third step of analysis
The intensities of the resulting zone of interest (ZI) are calculated as the difference between the average values of pixel intensities in stress (FT) and calm (background) states:

where: r(x, y) is the pixel of the resulting area with coordinates (x, y); pa(x, y) is the average value of a pixel of the excited state region with coordinates (x, y); p(x, y) is the average value of a pixel of the region of the quiescent state with coordinates (x, y).
4. Fourth (final) step of analysis
Based on the resulting region r,the surface is built for the “height of points” with coordinates (x, y) which correspond to the value r(x, y). Positive and negative height values of this surface are an increase or decrease in the intensity of IR-THz radiation at the moments that are synchronized with the peaks of simultaneously recorded GSRs. Heights around zero characterize the absence of changes in the intensity of radiation (see Figures 3–5in “Results and Discussion”, below).
To obtain a pseudo-color IR-THz image, a histogram was constructed, all points of which were divided into three clusters by using two adaptive thresholds P1and P2, varying from frame to frame, while maintaining a symmetrical arrangement relative to the maximum of the histogram (for an algorithm for such a clustering, see Berlovskaya et al., 2019) (see below. Figures 3–4).
Statistical Analysis of Group Data
For the above general statistics (mean, standard deviation, etc.), the analysis was performed with ANOVA calculation software (stats 3.5.1), following pair-wise comparisons of the results using the t-test with Tukey's range test for multiple comparisons.
To classify subjects into groups according to several psychological and psychophysiological parameters, statistical data processing was performed using the R language (version 3.5.1) (RCore Team, 2019) and the RStudio interactive development environment (version 1.1.463) (RStudio Team, 2018). Subjects were clustered using the k-means method (Hartigan & Wong, 1979), implemented in R as part of the basic stats package; the NbClust package was used to determine the optimal number of clusters (Charrad, Ghazzali, Boiteau, & Niknafs, 2014). The factoextra (Kassambara & Mundt, 2017) and ggplot2 (Wickham, 2009) packages were used to present clustering data with application of the principal component analysis (PCA) (Mardia, Kent, & Bibby, 1979).
To establish the relationships among psychological, psychophysiological, and physical data, the Spearman rank correlation method was used.
Results and Discussion
Psychological Testing and Psychophysiological Experiments
Complex Character of Connections Between Psychological and Psychophysiological Indicators of Stressful PES
The averaged group data of psychological measurements are presented in Table 1and Figure 1.
Table 1
Descriptive statistics of psychophysiological parameters (indexes) registered in different functional trials
|
Physiological index |
HR |
GSR |
ASW |
|||||||||
|
Functional trial (FT) |
BG |
FTC |
FTE |
FTP |
BG |
FTC |
FTE |
FTP |
BG |
FTC |
FTE |
FTP |
|
Number of subjects |
32 |
32 |
32 |
32 |
32 |
32 |
32 |
32 |
32 |
32 |
32 |
32 |
|
Average value |
73.6 |
89.6 |
72 |
97.2 |
186 |
384 |
422 |
302 |
2.69 |
1.88 |
1.95 |
5.08 |
|
Standard deviation |
12.4 |
16.5 |
12.2 |
21.3 |
173 |
322 |
279 |
299 |
2.04 |
1.64 |
1.95 |
2.98 |
Note. For abbreviations, see “Methods”, above. For description of the table with indication of reliability of differences among indexes (GSR, ASW) in FT (FTC, FTE, FTP) and the same indexes in BG, see text below.
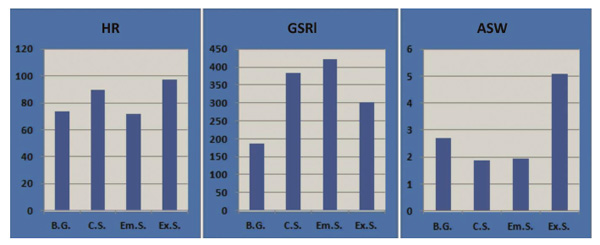
Figure 1. Averaged psychophysiological parameters of PES in different functional trials. The diagrams are constructed according to Table 1. HR – heart rate; GSRl – normalized length of the GSR profile (conventional units); ASW – amplitude of systolic wave of PPG (conventional units); B.G. – registration of indicators in background (calm) state; C.S. – FT with cognitive loading (FTC); Em.S. – FT with emotional loading (electro-skin stimulation) (FTE); Ex.S. – FT with physical exercises (FTP). For details concerning measuring of indexes, see section “Special Analysis of Psychophysiological Data”, above.
To assess the significance of the differences between the mean values of psychophysiological parameters in different FTs, the ANOVA method was used with subsequent pairwise comparisons through the t-test with Tukey correction for multiple comparisons. The resulting data (Table 1, Figure 1) illustrate the marked differences of the relationships of different psychophysiological indicators of PES with different FTs. For example, the HR has higher values in FTC and FTP as compared to BG and FTE. The differences between these FT pairs are statistically significant. Within the pairs there are no differences: df= 3, F= 18.9, p < 0.001; the size of η2effect is 0.314; in t-tests of pairwise comparisons, all p < 0.001.
GSR indicators in FTC and FTE have large values, which are significantly different from BG and do not differ between themselves: df = 3, F = 4.6, p < 0.01; the size of η2is 0.101; in t-tests of pairwise comparisons all p< 0.05.
ASW indicators in FTP have a greater value than in other FTs: df= 3, F= 5.24, p < 0.01; the size of η2effect is 0.114; in t-tests of pairwise comparisons p < 0.05.
Thus, each FT is most fully characterized by a specific pattern (vector) of psychophysiological indicators. It can be assumed that the contribution of each of the indicators to the total diagnostic complex depends, at least, on a combination of two factors: the subjective importance of the stressor for the recipient and his/her particular psychophysiological status. By psychophysiological status (PFS), we mean an individual’s (or group’s) resistance to various stressors, as well as ways to respond to stress (coping strategies). Such factors as genetic predisposition, type of higher nervous system, personality traits, coronary types of behavior “A” or “B” have a significant impact on PFS. To identify statistically significant relationships between different indicators of PES, we averaged the values of the psychological and psychophysiological indicators across the group (n= 32) for all FTs and thereby defined the group Psychophysiological Status. For comparative analysis, these data are combined in Table 2with measurements of IR-THz radiation.
Table 2
Group psychophysiological status of all the subjects who participated in the experiments (n=32)
|
|
Descriptive statistics for the whole group (n = 32)
|
||||||||
|
Indicators of PES |
IK |
SPILB.R |
SPILB.P |
Ch. St |
ITRf |
ITRo |
HR |
GSR |
ASW |
|
Mean |
0.039 |
39.6 |
44.2 |
45.7 |
3.69 |
0.656 |
72 |
422 |
1.95 |
|
Standarderror |
0.0293 |
1.61 |
2.2 |
2.05 |
0.685 |
0.645 |
2.16 |
49.3 |
0.344 |
|
Median |
0.0484 |
40 |
43 |
44.4 |
4 |
0.5 |
70.7 |
354 |
1.06 |
|
Standard deviation
|
0.166 |
9.09 |
12.4 |
11.6 |
3.87 |
3.65 |
12.2 |
279 |
1.95 |
Notes. The table shows the results of statistical analysis of psychological tests, psychophysiological experiments, and measurements of IR-THz radiation, averaged over all FTs. IK – value of Kerdo Index; Ch.St – scores on Leonova questionnaire; SPILB.R – indexes of state anxiety (STAI-K test); SPILB.P – indexes of trait anxiety (STAI-K test); ITRf – intensity of THz radiation on the forehead; ITRo – intensity of THz radiation in the periorbital area. For other abbreviations see “Methods” above.
Data of Table 2, processed by Spearman rank correlation, are presented in Table 3.
Table 3
Matrix of Spearman rank correlation coefficient (rho)
|
|
|
IK |
Ch.S |
SPILB.R |
SPILB.P |
ITRf |
ITRo |
HR |
GSR |
|
IK |
Spearman's rho |
— |
0.008 |
-0.015 |
0.034 |
0.023 |
0.159 |
-0.052 |
0.147 |
|
|
p-value |
— |
0.966 |
0.934 |
0.851 |
0.902 |
0.384 |
0.777 |
0.421 |
|
Ch.S |
Spearman's rho |
|
— |
0.672*** |
0.778*** |
0.326 |
-0.125 |
0.03 |
0.13 |
|
|
p-value |
|
— |
< 0.001 |
< 0.001 |
0.069 |
0.496 |
0.869 |
0.477 |
|
SPIL.R |
Spearman's rho |
|
|
— |
0.751*** |
0.022 |
-0.146 |
0.097 |
0.084 |
|
|
p-value |
|
|
— |
< 0.001 |
0.907 |
0.427 |
0.597 |
0.649 |
|
SPIL.P |
Spearman's rho |
|
|
|
— |
0.276 |
-0.15 |
0.103 |
0.176 |
|
|
p-value |
|
|
|
— |
0.127 |
0.413 |
0.576 |
0.336 |
|
ITRf |
Spearman's rho |
|
|
|
|
— |
0.196 |
-0.225 |
0.334* |
|
|
p-value |
|
|
|
|
— |
0.283 |
0.216 |
0.048 |
Notes. Significances: * p < 0.05, ** p < 0.01, *** p < 0.001
For abbreviations see Notes to Table 2.
Table 3 clearly illustrates the statistically significant positive correlations between the scores of the STAI-K test and those of the Leonova questionnaire. The lack of reliable correlations between the data of psychological tests and physiological indicators should also be noted. Such a discrepancy between the results of psychological and physiological measurements suggests that for reliable identification of PESs, using only psychological or only psychophysiological techniques is not enough, and these different technologies should be combined into a united diagnostic complex.
The following section illustrates the use of this complex psychophysiological approach to the assessment of PESs of volunteers in a situation of FTE (FT with emotional loading).
Using a Set of Psychological and Psychophysiological Indicators for the Complex Assessment of PES
For integrated psychophysiological assessment of the PES, we used the individual scores of psychological testing (STAI-K test and Leonova questionnaire) in combination with values for HR, ASW, RR, and GSR, which were registered in the FTE while a sharp, unpleasant, loud scream was used as a stressor.
Twenty-seven volunteers took part in this special experimental series (ages 17–24, mean age 19.1±4.2, females 14). First, the values for HR, ASW, RR, and GSR for background were recorded (3 min), after which the participant was subjected to 3 minutes of loud shouts (5 shouts in total) at intervals of 20 to 30 seconds. The dependent and independent variables were the value of the physiological indicator and the number of the shout (between 1 and 5), respectively. The resulting records were cleared of artifacts, and the average values were calculated. For each subject, the average values of the indicators at the time of each shout were calculated; these were then used for the linear regression procedure by the method of least squares. Thus, the experiments with shouts was characterized by two types of indices: the intercept and the slope of the line. The first index may be described as the average value of an indicator, and the second as the speed, at which the reaction of the subject fades before each new shout. The mean values of the baseline recording were subtracted from the values of the intercepts. These indicators were then used as a measures of PES change.
The statistical data obtained in this way and characterizing the PES in the FTE situation, were then used for clustering the subjects (for methods of statistical processing and clustering, see “Methods”, above). The preliminary number of clusters was estimated as 2–3, using the NbClust package (Charrad et al., 2014). Both hypotheses (2 or 3 clusters) were visually tested by reducing the dimension of the data by the principal component method (PCA) (Mardia et al., 1979) and projecting the clusters onto first two principal components. As a result, three linearly separable clusters were identified (Figure 2),using the packages factoextra (Kassambara & Mundt, 2017) and ggplot2 (Wickham, 2009).
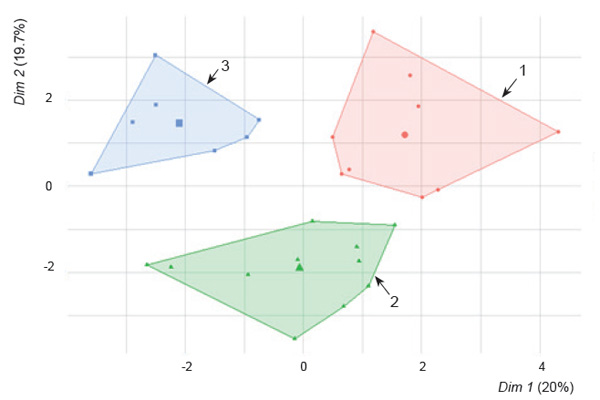
Figure 2. Clusters of subjects in the space of two main components (Dim 1 and Dim 2). On the axes of the graph are the coordinates of the subjects (the values of the first two components), as well as the percentage (%) of variance explained by each component. On the graph itself, the test subjects and centroids corresponding to each cluster are represented by circles (in cluster 1), triangles (in cluster 2), and rectangles (in cluster 3). The subjects of the same cluster are within a single polygon. For more details, see the text.
To assess the quality of clustering, we used the Dunn index (Dunn, 1974; Song, Di Matteo, & Aste, 2012) implemented in the fpc package (Handl, Knowles, & Kell, 2005; Hennig, 2018). There are several variants of the index. We applied the most commonly employed version, the ratio between the minimum averaged difference between clusters and the maximum averaged difference within a cluster. For our case, the ratio is 0.91, which indicates a statistically reliable distribution of subjects in clusters.
When analyzing the results of such complex clustering (Figure 2), it is important to pay attention to the fact that the same clusters contain subjects who would be in different groups, if only psychological tests or only psychophysiological indicators were used to classify their PESs. For example, cluster 1 of subjects with a high level of anxiety and chronic stress includes the persons with high scores on the STAI-K test and Leonova questionnaire, as well as subjects with a slow decay of the GSR (the psychophysiological indicator of low anxiety and stress). On the other hand, clusters 2 and 3 include persons with relatively low anxiety and chronic stress. In cluster 2 there are subjects having the lowest scores on the test and questionnaire (low level of anxiety and chronic stress) and average values for GSR reduction (relatively high anxiety and stress). And the subjects from cluster 3 are characterized by the very rapid decrease of GSR (low level of anxiety) associated with average scores on psychological testing (average anxiety and stress).
This complex clustering allows us to conclude that for effective diagnosis and, especially, prediction of PES changes, it is important to consider both psychological (subjective) and psychophysiological (objective) data. The need for such an integrated approach is a matter of debate. For instance, Hong & Hong (2015) propose to extract stress-induced thermal imprints through the differential IR energy between the philtrum (part of the maxillary area) and the forehead, disregarding personal factors. In our view, an effective assessment of PESs and prediction of their changes over time is possible only when we have information about the individual’s psychophysiological status (PFS; defined above). Both the psychological and physiological parameters of this status should be considered in the diagnosis of PES, as part of the reference base (along with the current background functional state).
Correlation of the Results of Analysis of Remotely Recorded IR-THz Images with Contact Measurements of GSR
To study the correlations of radiation in the IR-THz range with the GSR, the FTE series was selected, where the changes in the GSR in response to the stressor (a weak electric shock) are best expressed against the background of small values of ASW and HR (Figure 2). Figures3–5 represent the results of measuring the spatial distribution of IR-THz emissions in the forehead (for a description of the method for constructing “activation IR-THz surfaces”, see “Special Analysis of IR-THz Images” section, above).
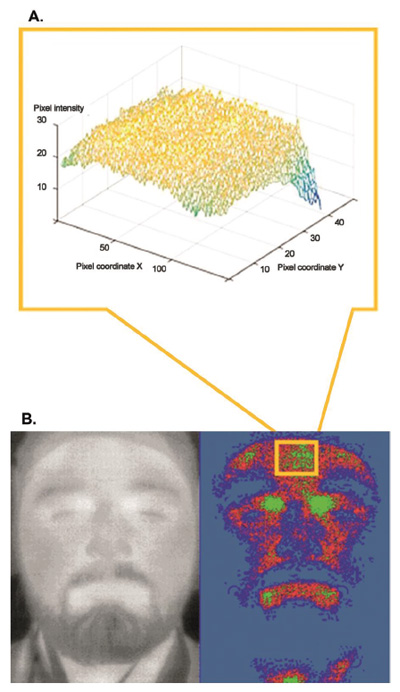
Figure 3. IR-THz image for the forehead zone of interest (in yellow square) at background state (BG)
A. Pixel coordinates of the IR-THz image are indicated along the X and Y axes,and pixel intensity along Z axis (50 × 150 × 30). The area limited by X × Y pixels represents the forehead area. The coordinates of Z pixels denote the intensity of THz radiation, varying from low values (blue pixels) to high ones (red pixels).
B. The original IR-THz image in black and white (left) and pseudo-color image (right).
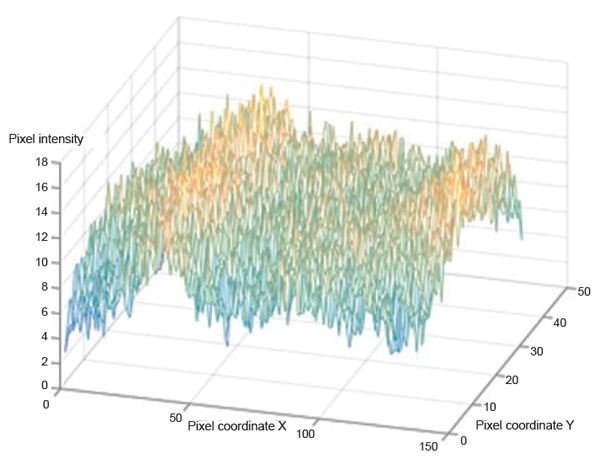
Figure 4. The result of the IR-THz image subtraction for the calm state (Figure 3) from the IR-THz image for the excited (FTE) state. Both IR-THz images (for BS and FTE) were obtained for the moments when the amplitude maxima of the synchronously recorded GSR were observed. For abbreviations, see Figure 3A.
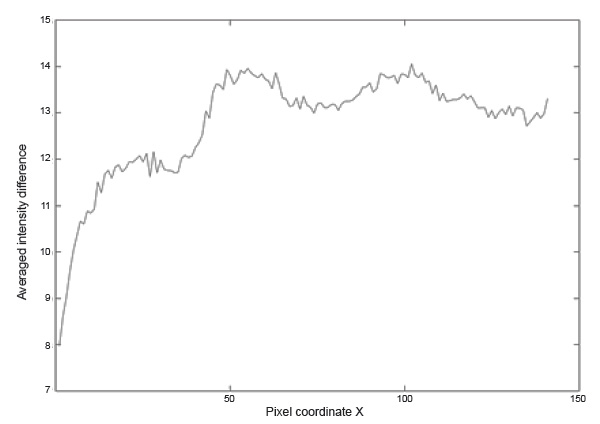
Figure 5. Distribution of data presented in Figure 4with averaged values across Y axis and spanned along X axis which is the width of forehead zone of interest (Figure 3). Higher Intensity values indicate more intense IR-THz radiation in the FTE situation.
The Table 3 data (see above) indicate that there is a statistically significant moderate correlation between the intensity of the IR-THz signal in the forehead and the GSR (Spearman coefficient = 0.334, p< 0.05). These data coincide with the data of Puri et al. (2005), which showed that the affective stressful states of computer users are correlated with increased blood flow in the frontal vessels of the forehead. That flow dissipates convective heat, which can be monitored through IR imaging. Hong (2016) also used IR signals from blood vessels in the human forehead to establish a classification model of emotional and physical stress.
It is important to note that this correlation is observed in the range of ±2 seconds relative to each GSR peak. This is quite a significant result, considering that all currently available measurements of IR radiation (without expansion into the THz range) and GSR indicate the presence of a long time lag between the appearance of the IR signal (> 10 s) and the generation of the GSR (3–5 s) (Ioannou et al., 2014).
There are questions about the origins of these discrepancies for the informativeness of measurements in the IR and IR-THz ranges. What is the role of the expansion of IR radiation in the THz range? Are there specific sources of THz radiation in a living body?
Despite the presence of the electric fields in the body and associated streams of differently charged atoms and molecules, as well as the translocation of polar molecules in the life cycle of any cell, the range of the electromagnetic spectrum in nature is very limited: This is either a static field (the potential of a resting membrane) or low-frequency oscillations Hz range (ion permeability kinetics) (Romanenko, Begley, Harvey, Hool, & Wallace, 2017). However, H. Fröhlich (Fröhlich, 1968) put forward a hypothesis about the existence of electromagnetic oscillations in living cells with frequencies up to several THz. The existence of longitudinal electric modes in biological systems is based on the unique dielectric properties of cell membranes and weak molecular bonds – for example, hydrogen. Research on the role and importance of collective interactions in biological systems has been a subject of relatively new scientific interest (Weightman, 2012). The results of these studies are to some extent consistent with Fröhlich's initial theoretical conclusions about the role and significance of THz radiation in biology. In brief, Fröhlich suggested that there is a system of dipole oscillators capable of forming long-range Coulomb interactions. Energy exchange is carried out with the help of energy quanta in a limited frequency range, and the whole system "generates a branch of Z-longitudinal electrical oscillations" (Fröhlich, 1986), with a limited frequency range. Moreover, if such a system has a stable and sufficient supply of energy, then it is possible to attain a steady state, which may be far from thermodynamic equilibrium (Fedorov, Serdyukov, Cherkasova, Popova, & Nemova, 2017).
The hypothesis that the sweat ducts of human skin can be the biological equivalent of helical antennas and, consequently, resemble their electromagnetic behavior when receiving signals in the THz frequency range (Kochnev, Betzalel, Ben Ishai, & Feldman, 2018), has been actively developed and received experimental confirmation in recent years. The sweat glands are controlled by the central nervous system; when activated, they release sweat into the sweat ducts – small tubular structures distributed throughout the outer layer of the skin – which in turn deliver sweat to the surface of the skin, where it evaporates. Signals from the sweat ducts are promising for the development of remote sensors for stress states and physiological parameters based on diagnostics of THz signals. It has been shown that sweating from the pores of the fingers can be recorded on IR images and perspiration drops may appear and disappear in less than 1 s. Their dynamics correlate well with the SGR signal (Znamenskaya et al., 2018).
Limitations
In the process of recording and analyzing IR-THz images, it was found that involuntary head movements associated with the stabilization of the body in space have a noticeable effect on the results of image processing, and this must be taken into account when further developing sensors for diagnosing PESs in real time (Berlovskaya et al., 2019).
Conclusion: Main Experimental Findings and Directions for Future Research
The results indicate that the subjective data of psychological testing of PESs may not coincide with the data of objective psychophysiological measurements. Perhaps these misalignments are due to the fact that for the assessment of PESs, different markers are distinguished and compared, namely, "direct" or primary, and "indirect" or secondary ones. Direct markers of PESs are those physiological processes that are directly involved in realizing the PES (first of all the hypothalamic-pituitary-adrenal axis). Indirect markers of PES are those psychological reactions and states that are the result of the restructuring of physiological processes under the influence of individual experience. It follows that for effective diagnosis and prediction of PES changes, it is important to consider both psychological (subjective) and psychophysiological (objective) data. The only question is how to organize the integration of these heterogeneous data and to consider their contribution to the complex assessment of PESs.
Of the greatest interest for applied psychophysiology is the correlation of the intensity of IR-THz radiation in the forehead with GSR, the most popular indicator of PESs. Along with data concerning the possibility of using THz waves for assessment of blood vessels (Berlovskaya et al., 2019), this opens up prospects for the development a new methodology for distant monitoring of the PES, based on IR-THz imaging of the face.
Our experiments showed that when a subject inhales, the intensity of the THz contribution to the total IR-THz signal of the radiation from the regions of the wings of the nose decreases. This phenomenon can be used to develop algorithms for contactless registration of the respiratory rhythm based on the analysis of THz images (Berlovskaya et al., 2019).
The results of this work and our previous research (Berlovskaya et al., 2019) show that, despite the relatively low signal-to-noise ratio and low frequency of image recording, it is possible to extract informative THz parameters of the broadband IR-THz signal and associate them with psychophysiological reactions (vascular system, GSR) confirmed by other methods of objective monitoring. It is obvious that improvement of IR-THz detectors and the development of new processing methods will allow wide use of the THz range for remote assessment of human PESs.
Acknowledgements
The research was supported by the Russian Foundation for Basic Research (project No. 17-29-02487). The authors acknowledge partial support from the Ministry of Science and Higher Education within the State assignment FSRC “Crystallography and Photonics”, Russian Academy of Science, and the M.V. Lomonosov Moscow State University Program of University Development up to 2020.
References
Angeluts, A.A., Balakin, A.V., Evdokimov, M.G., Esaulkov, M.N., Nazarov, M.M., Ozheredov, I.A., … Shkurinov, A.P. (2014). Characteristic responses of biological and nanoscale systems in the terahertz frequency rangeQuantum Electronics, 44(7), 614–632. http://dx.doi.org/10.1070/QE2014v044n07ABEH015565
Batarshev, A.V. (2005). Bazovye psikhologicheskie svoystva i samoopredelenie lichnosti: Prakticheskoe rukovodstvo po psikhologicheskoy diagnostike[Basic psychological properties and self-determination of personality: Practical guide to psychological diagnosis]. St. Petersburg.: Rech’.
Berlovskaya, E.E., Cherkasova, O.P., Ozheredov I.A., Adamovich, T.V., Isaychev E.S., Isaychev, S.A., … Shkurinov, A.P. (2019). New approach to terahertz diagnostics of human psychoemotional state. Quantum Electronics, 49(1), 70–77. https://doi.org/10.1070/QEL16906
Bowling Barnes, R. (1963). Thermography of the human body. Science, 140(3569), 870–877. https://doi.org/10.1126/science.140.3569.870
Cardone, D., Pinti, P., & Merla, A. (2015). Thermal infrared imaging-based computational psychophysiology for psychometrics. Computational and Mathematical Methods in Medicine, Article ID 984353. http://dx.doi.org/10.1155/2015/984353.
Cardone, D., & Merla, A. (2017). New frontiers for applications of thermal infrared imaging computational psychophysiology in the neurosciences. Sensors,17(1042), 1–21. https://doi.org/10.3390/s17051042
Charrad, M., Ghazzali, N., Boiteau, V., & Niknafs, A. (2014). NbClust: An R package for determining the relevant number of clusters in a data set. Journal of Statistical Software, 61(6), 1–36. https://doi.org/10.18637/jss.v061.i06
Chernorizov, A.M., Isaychev, S.A., Zinchenko, Yu.P., Galatenko, V.V, Znamenskaya, I.A., Zakharov, P.N., … Gradoboeva, O.N. (2016). Psychophysiological methods for the diagnostics of human functional states: New approaches and perspectives. Psychology in Russia: State of the Art, 9(4), 23–36. https://doi.org/10.11621/pir.2016.0403
Dunn, J.C. (2008). Well separated clusters and optimal fuzzy partition. Journal of Cybernetics and Systems, 4,95–104. http://doi.10.1080/01969727408546059
Egoskop (2019). Retrieved from: http://www.medcom.ru/medicom/ego.htm
Fedorov, V.I., Serdyukov, D.S., Cherkasova, O.P., Popova, S.S., & Nemova, E.F. (2017). The influence of terahertz radiation on the cell’s genetic apparatus. Journal of Optical Technology, 84(8), 509–514. https://doi.org/10.1364/JOT.84.000509
FLIR. Retrieved from: https://www.flir.com/browse/rampd-and-science/high-performance-cameras/.
Friedman, М., & Rosenman, R.Н. (1959). Association of specific overt behavior pattern with blood and cardiovascular findings. Journal of the American Medical Association, 169, 1286–1296, http://dx.doi.org/10.1001/jama.1959.03000290012005
Fröhlich, H. (1968). Long-range coherence and energy storage in biological systems. Int. J. Quantum Chem., 2,641–649. https://doi.org/10.1002/qua.560020505
Fröhlich, H. (1986). Coherent excitation in active biological systems.In F. Gutmann & H. Keyzer (Eds.), Modern bioelectrochemistry(pp. 241–261). Boston, MA: Springer. https://doi.org/10.1007/978-1-4613-2105-7_8
Handl, J., Knowles, K., & Kell, D. (2005). Computational cluster validation in post-genomic data analysis. Bioinformatics, 21(15), 3201–3212. https://doi.org/10.1093/bioinformatics/bti517
Hartigan, J.A., & Wong, M.A. (1979). Algorithm AS 136: A K-means clustering algorithm. Applied Statistics, 28,100–108. https://doi.org/10.2307/2346830
Hennig, C. (2018). Fpc: Flexible procedures for clustering. R package version 2.1-11.1. Retrieved from: https://CRAN.R-project.org/package=fpc
Hong, K. (2016). Classification of emotional stress and physical stress using facial image feature. Journal of Optical Technology, 83(8), 508–512. https://doi.org/10.1364/JOT.83.000508
Hong, K., & Hong, Sh. (2015). Real-time stress assessment using thermal imaging. The Visual Computer, 32(11), 1369–1377. https://doi.org/10.1007/s00371-015-1164-1
Hough, C.M., Purschke, D.N., Huang, C., Titova. L.V., Kovalchuk. O., Warkentin, B.J., & Hegmann, F.A. (2018). Global gene expression in human skin tissue induced by intense terahertz pulses.Terahertz Science and Technology, 11,28–33. https://doi.org/10.11906/TST.028-033.2018.03.03
Huntzsche, H., & Stopper, H. (2012). Effects of terahertz radiation on biological systems. Critical Reviews in Environmental Science and Technology,42(22), 2408–2434. https://doi.org/10.1080/10643389.2011.574206
Ioannou, S., Gallese, V., & Merla, A. (2014). Thermal infrared imaging in psychophysiology: Potentialities and limits. Psychophysiology (USA), 51, 951–963. https://doi.org/10.1111/psyp.12243
Isaychev, S.A., Chernorizov, A.M., Korolev, A.D., Isaychev, E.S., Dubynin, I.A., & Zakharov, I.M. (2012). The psychophysiological diagnostics of the functional state of the athlete. Preliminary data. Psychology in Russia: State of the Art, 5, 244–268. https://doi.org/10.11621/pir.2012.0015
Kassambara, A., & Mundt, F. (2017). Factoextra: Extract and visualize the results of multivariate data analyses. R package version 1.0.5. Retrieved from: https://CRAN.R-project.org/package=factoextra
Kerdö, I. (1966). Ein aus Daten der Blutzirkulation kalkulierter Index zur Beurteilung der vegetativen Tonuslage. Acta neurovegetativa, 29(2), 250–268. https://doi.org/10.1007/bf01269900
Kochnev, A., Betzalel, N., Ben Ishai, P., & Feldman, Yu. (2018). Human sweat ducts as helical antennas in the sub-THz frequency range-an overview. Terahertz Science and Technology, 11(2), 43–56. https://doi.org/10.11906/TST.043-056.2018.06.05
Kosonogov, V., De Zorzi, L., Honoré, J., Martínez-Velázquez, E.S., Nandrino, J.-L., Martinez-Selva, J.M., & Sequeira, H. (2017). Facial thermal variations: A new marker of emotional arousal. PLoS ONE, 12(9), e0183592. https://doi.org/10.1371/journal.pone.0183592/
Kudryashov, Yu.B., Perov, Yu.F., & Rubin, A.B. (2008). Radiatsionnaya biofizika: radiochastotnye i mikrovolnovye elektromagnitnye izlucheniya[Radiation biophysics: Radio frequency and microwave electromagnetic radiations]. Moscow: Fizmatlit
Lebedev, V.V., Isaychev, S.A., Chernorizov, A.M., & Zinchenko, Yu.P. (2013). Vector approach to integral evaluating of sportsmen functional states. Procedia-Social and Behavioral Sciences(Elsevier Ltd., Netherlands), 86, 610–614. https://doi.org/10.1016/j.sbspro.2013.08.622
Lee, Y.-S. (2009). Principles of terahertz science and technology. Boston, MA: Springer-Verlag US. https://doi.org/10.1007/978-0-387-09540-0
Leonova, A.B. (2016). Kompleksnye psikhologicheskie tekhnologii upravleniia stressom i otsenka individual’noi stress-rezistentnosti: opyt integratsii razlichnykh issledovatel’skikh paradigm. [Complex psychological stress management techniques and assessment of individual stress-resistance: The experience of integrating different research paradigms]. Vestnik Moskovskogo Universiteta. Seriia 14. Psikhologiia. [Moscow University Bulletin. Series 14. Psychology], 3,63–72. https://doi.org/10.11621/vsp.2016.03.63
Mardia, K. V., Kent, J.T., & Bibby, J.M. (1979). Multivariate analysis. London: Academic Press
Minvaleev, R.S., Sarana, A.M., Sсherbak, S.G., Glotov, A.S., Glotov, O.S., Mamaeva, O.P., … Summerfield, D.T. (2018). Autonomic control of muscular activity before and after exposure to altitudes of 2000–3700 m. Human Physiology,44(5), 556–564. https://doi.org/10.1134/S0362119718030106
NEC (2014). Retrieved from: https://www.nec.com/en/press/201411/images/1101-01-01.pdf
Oda, N., Lee, A., Ishi, T., Hosako, I., Hu, Q. (2012) Proposal for real-time terahertz imaging system, with palm-size terahertz camera and compact quantum cascade laser. Proceedings of SPIE,8363, 83630A1-83630A-13. https://doi.org/10.1117/12.917682
Pakhomov, A.G., Akyel, Y., Pakhomova, O.N., Stuck, B.E., & Murphy, M.R. (1998). Current state and implications of research on biological effects of millimeter waves: a review of literature. Bioelectromagnetics,19(7), 393–413. https://doi.org/10.1002/(SICI)1521-186X(1998)19:7<393::AID-BEM1>3.0.CO;2-X
Pavlidis, I., & Levine, J. (2001). Monitoring of periorbital blood flow rate through thermal image analysis and its application to polygraph testing. Conference Proceedings of the 23rd Annual International Conference of the IEEE Engineering in Medicine and Biology Society,25–28 Oct. 2001, Istanbul, Turkey,3, 2826–2829. https://doi.org/10.1109/IEMBS.2001.1017374
Puri, C., Olson, L., Pavlidis I., Levine, J., & Starren, J. (2005). StressCam: non-contact measurements of users’ emotional states though thermal imaging. CHI '05 Extended Abstracts on Human Factors in Computing Systems, Portland, Oregon, USA, April 2–7,1725–1728. https://doi.org/10.1145/1056808.1057007
R Core Team (2019). R: A language and environment for statistical computing. R Foundation for Statistical Computing, Vienna, Austria. Retrieved from: https://www.R-project.org
Romanenko, S., Begley, R., Harvey, A.R., Hool, L., & Wallace, V.P. (2017). The interaction between electromagnetic fields at megahertz, gigahertz and terahertz frequencies with cells, tissues and organisms: risks and potential. Journal of the Royal Society Interface, 14, 20170585. https://doi.org/10.1098/rsif.2017.0585
R Studio Team (2018). RStudio: Integrated development environment for R. Boston, MA: RStudio, Inc., Retrieved from: http://www.rstudio.com
Smolyanskaya, O.A, Chernomyrdin, N.V., Konovko, A.A., Zaytsev, K.I., Ozheredov, I.A., Cherkasova, O.P. … Tuchin, V.V. (2018). Terahertz biophotonics as a tool for studies of dielectric and spectral properties of biological tissues and liquids. Progress in Quantum Electronics, 62,1–77. https://doi.org/10.1016/j.pquantelec.2018.10.001
Song, W.M., Di Matteo, T., & Aste, T. (2012). Hierarchical information clustering by means of topologically embedded graphs. PLoS ONE, 7(3): e31929. https://doi. org/10.1371/journal.pone.0031929
Sun, Q., He, Y., Liu, K., Fan, S., Parrott, E.P.J., & Pickwell-MacPherson, E. (2017). Recent advances in terahertz technology for biomedical applications. Quantitative Imaging in Medicine and Surgery,7(3), 345–355. https://doi.org/10.21037/qims.2017.06.02
Terahertz Imager (2019). Retrieved from: https://www.datasheetarchive.com/whats_new/d29fd2b64fe291147482ad471ba853f7.html
Vodopyanov, N.E. (2009). Psikhodiagnostika stressa[Psychological diagnosis of stress]. St. Petersburg: Piter.
Weightman, P. (2012). Prospects for the study of biological systems with high power sources of terahertz radiation.Physical Biology, 9(5), 053001. https://doi.org/10.1088/1478-3975/9/5/053001
Wickham, H. (2009). Ggplot2: Elegant graphics for data analysis.New York: Springer-Verlag. https://doi.org/10.1007/978-0-387-98141-3
Wilmink, G. J., & Grundt, J. E. (2011). Invited review article: Current state of research on biological effects of terahertz radiation. Journal of Infrared, Millimeter, and Terahertz Waves, 32,1074–1122. https://doi.org/10.1007/s10762-011-9794-5
Yang, X., Xiang Zhao, X., Yang, K., Liu, Y., Liu, Y., Fu, W., & Luo, Y. (2016). Biomedical applications of terahertz spectroscopy and imaging. Trends in Biotechnology, 34(10), 810–824. https://doi.org/10.1016/j.tibtech.2016.04.008
Zhang, X.-C., & Jingzhou Xu (2010).Introduction to THz wave photonics. Springer Science + Business Media, LLC . https://doi.org/10.1007/978-1-4419-0978-7
Znamenskaya, I., Koroteeva, E., Isaychev, S., & Chernorizov, A. (2018). Thermography-based remote detection of psycho-emotional states. 14th Quantitative InfraRed Thermography Conference, 25–29 June 2018, Berlin, Germany,51–56. https://doi.org/10.21611/qirt.2018.p13
To cite this article: Berlovskaya, E.E.,Isaуchev, S.A., Chernorizov, A.M., Ozheredov, I.A., Adamovich, T.V., Isaуchev, E.S., … Manaenkov, A.E. (2020). Diagnosing Human Psychoemotional States by Combining Psychological and Psychophysiological Methods with Measurements of Infrared and THz Radiation from Face Areas. Psychology in Russia: State of the Art, 13(2), 64-83
The journal content is licensed with CC BY-NC “Attribution-NonCommercial” Creative Commons license.


