The Influence of the Polymorphism of BDNF, HTR2A, and COMT Genes on the Perception of Emotionally Charged Images
Abstract
Background. The genes responsible for regulating neuro-chemical metabolism are capable of influencing emotional responses.
Objective. The goal is to determine the influence of the polymorphism of BDNF, HTR2A, and COMT genes on potentials evoked in response to faces with various emotional expressions and objects with different emotional valences.
Design. The stimuli set included 175 faces and 150 objects with neutral, positive, and negative emotional content. All images were unified in size and brightness and presented for 500 ms. The participants’ task was to determine the emotional content of each stimulus. Each participant’s EEG was recorded at 128 points and averaged in alignment with her responses. Six measures of ERP were recorded for each lead: three for faces with different emotional expressions, and three for objects with different emotional valences.
Results. We discovered that the BDNF and HTR2A gene polymorphism does not affect the visual perception of emotionally charged stimuli as reflected in changes of ERP. By contrast, participants in the COMT Met-Met group differed from participants in groups COMT Val-Met and COMT Val-Val in that their ERPs for both faces and objects were characterized by an increase in P300 amplitude in their frontal, temporal, and parietal areas, predominantly in the right hemisphere. The COMT Met-Met participants were less successful in differentiating stimuli by their emotional valence.
Conclusion. The COMT gene mutation of the Met/Met type may lead to deficiencies in decision-making about the emotional valence of visual stimuli, as reflected in a substantial increase in the P300 response amplitude.
Received: 05.04.2019
Accepted: 09.12.2020
Themes: Ethical issues and challenges in psychological practice and research
PDF: http://psychologyinrussia.com/volumes/pdf/2020_2/Psychology_2_2020_47-63_Ermakov.pdf
Pages: 47-63
DOI: 10.11621/pir.2020.0204
Keywords: gene polymorphism; COMT; face; object; emotion; event-related potential (ERP)
Introduction
Typical research on visual processes relies on averaging individual data gathered from different observers in order to determine common characteristics of visual perception; the observed individual differences are then treated as random fluctuations. However, in-depth analysis reveals that, quite often, these individual differences are really systematic and could reflect underlying mechanisms of human perception and behavior. If so, studying individual differences in visual perception can be instrumental in understanding perception’s most profound mechanisms. Numerous studies acknowledge the existence of specific individual characteristics of visual perception that determine different degrees of successful image recognition within various emotional and semantic contexts. Substantial differences among individuals have been observed for various levels of information processing over the entire spectrum of visual perception (e.g., Braddick et al., 2017; Grzeczkowski, Clarke, Francis, Mast, & Herzog, 2017; López-Alcón, Marín-Franch, Fernández-Sánchez, & López-Gil, 2017; Sparrow, LaBarre, & Merrill, 2017; Witzel, O’Regan, & Hansmann-Roth, 2017).
Studying individual differences in cognitive processes has resulted, among other things, in a better understanding of the special role that neural mediators play in the functioning of brain structures; that, in turn, has attracted researchers’ attention to the issue of the influence of the genotype on the organization of cognitive processes (Billino, Hennig, & Gegenfurtner, 2017). Twin studies have shown that genetic factors underlie about 50 percent of the differences in intelligence among people. We hypothesized that the genotype affects the perception of emotionally charged stimuli, which is reflected in corresponding changes in ERP.
In recent years, so-called genome-wide association studies (GWAS) have been launched, which have aimed to determine whether any specific areas of the genome are associated with human cognitive abilities (Deary, 2013; Deary et al., 2009; Plomin & Deary, 2015; Sternberg, 2012). These works did not reveal any specific genes that play a key role in intellectual differences. It is likely that a large number of genes affect a person’s cognitive abilities, but each of them can make its own specific contribution.
Among the genes capable of influencing this perception, we highlight the following: the brain-derived neurotrophic factor (BDNF), 5-hydroxytryptamine receptor 2A (HTR2A), and catechol-O-methyltransferase (COMT). These genes determine specific protein structures, the duration of neural mediators’ active presence in synaptic space, and synaptic plasticity.
The BDNF gene of the neurotrophic brain factor is linked to the plasticity of neurons. This gene is the key component in regulating the development, differentiation, and functioning of the neuron chains (Park & Poo, 2013). It plays an important role in the regulation of synaptic plasticity (Korte, Kang, Bonhoeffer, & Schuman, 1998)and the implementation of cognitive functions (Getzmann, Gajewski, Hengstler, Falkenstein, & Beste, 2013; Proenca, Song, & Lee, 2016). Reduction in its activity leads to impaired learning ability (Bartoletti et al., 2002), most likely as a result of memory problems. A number of recent studies attempted analyses of interconnections between the BDNF gene and some characteristics of visual perception, specifically visual-motor adaptation (Barton et al., 2014). Some researchers assume that there is a link between the BDNF genotype and visual-spatial abilities (Alfimova et al., 2008). Also, there are some indirect indications that this gene could be implicated in visual recognition processes (Notaras, Hill, & van den Buuse, 2015).
The HTR2A gene defines the serotonin receptors, and thus, may influence the individual’s emotional reactions. There are also indications that this gene’s polymorphism is related to dynamic characteristics of cognitive processes (Golimbet, Volel, Dolzhikov, Korovaitseva, & Isaeva, 2014; Sukhodol’skaya, 2016; Švob Štrac, Pivac, & Mück-Šeler, 2016; Zainullina, Valiullina, & Khusnutdinova, 2016).
The crucial role of the COMT gene in decomposition of catecholamines determines the length of the monoamines’ existence in synaptic space, which may affect specific characteristics of visual stimuli recognition and the categorization of visual stimuli with different emotional valence (Bunyaeva, Kovsh, Skirtach, & Il’in, 2016; Kovsh, 2016; Vorobyeva, Ermakov, Kovsh, & Abakumova, 2017).
Currently there is no empirical data that would confirm connections between the above-mentioned genes and the individual characteristics of visual perception in its various stages. However, their specific contributions to neurochemical metabolism may be indicative of such a connection.
The main goal of the present study is to explore and describe how BDNF, HTR2A, and COMT gene polymorphism influences the visual perception of different emotionally charged images.
It is worth mentioning that typical studies of genes’ influence on the characteristics of cognitive processes are conducted within the framework of genetic and/or mental disorders (Dai et al., 2017; Fan et al., 2017; Ji et al., 2015; Lebe et al., 2013; Sujitha et al., 2014), whereas research on the impact of genotype on individual characteristics of cognitive processes in the general population is extremely limited.
Method
Participants
Fifty-four healthy young women, all students of Southern Federal University (SFU), Russia, ages 18 to 22, volunteered to participate in the study. They all had normal or corrected-to-normal vision.
Only women were tested, because there is evidence that the polymorphism of the studied genes can affect cognitive abilities of men and women in different ways (Harrison & Tunbridge, 2008; Tunbridge & Harrison, 2010).
The study was conducted in accordance with ethical standards consistent with the Code of Ethics of the World Medical Association (Declaration of Helsinki) and approved by the local SFU ethics committee.
Genotyping
Sixty-one participants were genotyped for the polymorphism of BDNF, HTR2A, and COMT genes, using samples of the buccal epithelium. Genotyping was performed with the allelic discrimination technique on a Biorad CFX-96 thermocycler (Berkeley, California, USA). For each of the genes studied, three variants of genotypes were possible: major (without mutations), heterozygous (one mutant allele), and minor (both mutant alleles).
EEG registration was carried out on the Neurovisor 136 encephalograph-analyser from 128 monopolar registration points, using an MCScap-AC128 helmet equipped with a set of removable electrodes. The electrodes were positioned according to the standard “10-10” system for EEG registration and also in some positions of the “10-5” system with the ear-placed electrodes as referents. Registration control and recording of the digitalized data was implemented within the NeoRec v. 1.4 software package on an x86_64–compatible personal computer with a Windows 10 operating system. The EEG was registered in the 0.5 – 50 Hz frequency range with an additional filter of 50 Hz. The frequency of signal digitalization was 1 kHz. EDFBrowser software (Teunis van Beelen) handled the conversion of event markers into text format.
Stimuli
As visual stimuli, we used 450 black-and-white photographic images of either human faces (natural) or objects (both real and virtual); they were evenly divided into three groups by their emotional valence (i.e.,neutral, positive, and negative).
The emotional valence of the objects was determined by an expert group. The object was assigned a certain valence if all experts (seven people) independently gave it the same rating (neutral, positive, or negative).
Images of human faces were selected from the following databases: Warsaw Set of Emotional Facial Expression Pictures (WSEFEP) (Olszanowski et al., 2015), MMI Facial Expression Database (Pantic, Valstar, Rademaker, & Maat, 2005), and Karolinska Directed Emotional Faces (KDEF) (Lundqvist, Flykt, & Öhman, 1998). The library of face stimuli included images of 175 models. Each was represented by three photographs that differed in emotional facial expression: neutral, positive, and negative. Thus, there were 525 images of human faces in total.
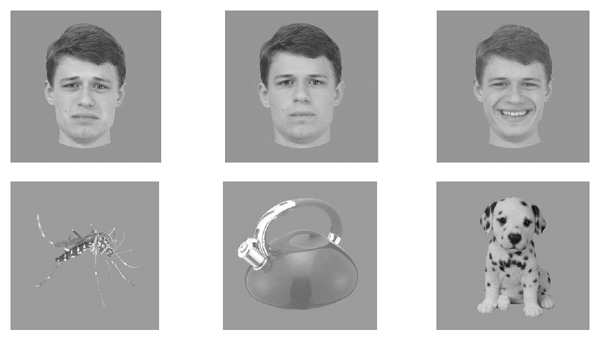
Figure 1. Examples of the stimuli used.
All visual stimuli (objects and faces) were matched in size so that they would fit perfectly in a circle of 880 pixels in diameter (at an approximately 14 degree angle from the observer’s perspective). They were also aligned by brightness and contrast and presented to participants on a grey background, whose brightness of 30 cd/m2 per square meter was equivalent to the brightness of the image itself. Figure 1 presents examples of the stimuli used.
Stimulation
The visual stimuli were administered using a tachistoscopic image presentation software package for the study of visually evoked potentials (Russian patent № 2015662151), which runs on an x386-compatible personal computer with an Ubuntu Linux 16.04 operating system. Stimuli appeared on the screen of the ViewSonic VX2263Smhl monitor with a pixel resolution of 1920 х 1080, and the dynamic contrast function was disabled for the duration of the study. Synchronization of EEG and the event markers was achieved by means of the TTL VGASens synchronization light sensor (photodiode) installed under the trigger zone of the monitor. The monitor calibration was performed using a ‘ТКА-ПКМ’(02) brightness tester on 256 gradations of brightness.
Procedure
We used a 3 x 3 between-subjects design, with the following factors: Genotype (Val/Val, Val/Met, Met/Met) and Emotion (negative, neutral, positive). The trials were grouped into two experimental blocksaccording to the type of stimuli (faces or objects). The Emotions varied randomly within a block.
Visual stimuli were presented to the study participants for 500 ms each. In Experiment One, the participants’ task was to identify the emotional expressions of the human faces being presented. In Experiment Two, the task was repeated using images of objects; the participants judged what emotional reaction each stimulus elicited. The participants indicated their respective decisions by pressing the designated key on the computer keyboard. The response input triggered the presentation of the next visual stimulus after a randomly selected pause within an interval of 500 to 1500 ms.
Data processing and analyses
Individual results were grouped according to the genotype of the BDNF, HTR2A, and COMT genes. The artefact-free EEG segments, encompassing intervals from 100 ms before the onset of the stimulus to 500 ms after it, were selected for subsequent averaging and processing. We averaged the responses to stimuli of a particular emotional valence with a minimum of 80 epochs per averaging.
The differences between the ERP measurements were calculated as follows. The amplitude of the ERP of each subject for each condition was evaluated every millisecond. After averaging the responses in each group with a certain genotype, differences in the amplitude of the compared ERPs were evaluated by the t-criterion (also every millisecond). To solve the problem of multiple comparisons, the Holm correction was used.
It is important to keep in mind that the emotional valence of the images of objects (unlike facial expressions) was not established a priori, but was decided upon and determined by the study participants. All statistical analyses were carried out with the EEGLAB (Delorme & Makeig, 2004)software package within the Matlab environment.
Results
Perception of human faces with different emotional expressions
In Experiment One, participants were to determine the emotional expression of human faces presented to them as target stimuli. We compared the ERP in response to faces with the same emotional expression between groups of participants with different genotypes for each of the genes under consideration.
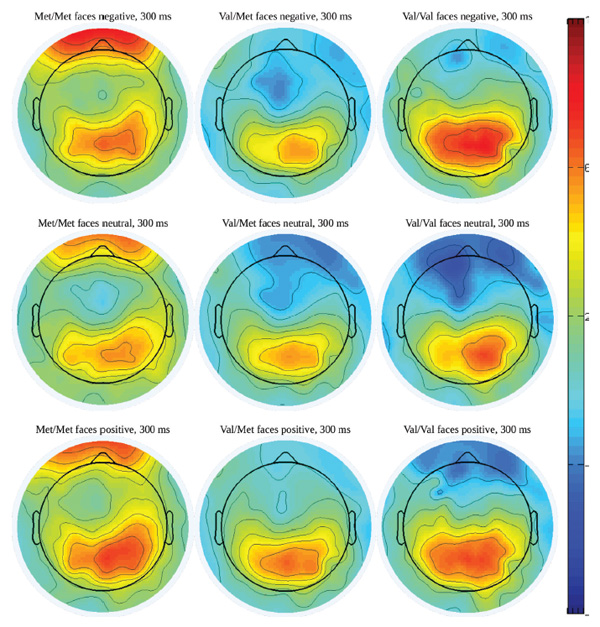
Figure 2. Potential maps with 300-ms latency in ERPs to faces with various emotional expressions among dierent COMT genotypes carriers.
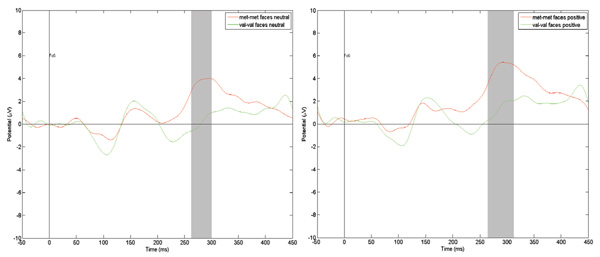
Figure 3. Comparison of the ERP scores at the T8 registration point to neutral and positive faces among dierent COMT genotypes carriers. e gray vertical bar represents the time interval when the amplitude dierence is statistically signicant (p < .01)
No statistically significant differences in participants’ responses were detected in groups with different genotypes of the BDNF gene or in groups with different genotypes of the HTR2A gene. However, groups of participants formed according to differences in genotype of the COMT gene, showed statistically significant differences in their reactions to all types of emotional expression on the images of human faces.
There was little difference in ERP scores between groups with genotypes Val/Val and Val/Met of the COMT gene, but they both showed significantly different reactions than those in the group with the Met/Met genotype. Moreover, the greatest differences were observed when the P300 wave formed. This is well illustrated in the corresponding potential maps (Figure 2). To reflect the most salient changes in the P300 wave specifically, these maps correspond to the latency of 300 ms. The differences we observed manifested themselves in the increased amplitude of the P300 wave in participants in the group with the Met/Met genotype of the COMT gene.
Figure 3 (above) shows reactions to the images of human faces with neutral and positive emotional expressions at the same FC6 registration point as in the COMT Met/Met and COMT Val/Val groups. e grey vertical stripe depicts temporal dia- pasons within which dierences in amplitude are statistically signicant at p < .01. In both cases, P300 amplitude in the COMT Met/Met group is signicantly higher than in the COMT Val/Val group.
Figure 4 (see below) features registration point maps that are characterized by statistically significant differences in the amplitude of the P300 wave in the groups under comparison. Red shows those positions in which we observed differences in response to faces with negative emotional expressions; yellow depicts registration points with differences in response to neutral facial expressions; and green represents registration points with differences in response to positive facial expressions. In the registration points marked in blue, significant differences were observed in response to all emotional expressions.
It is quite evident that these spatial distributions of between-group changes in P300 in the cortex are different across pairs of the compared groups. For example, for the COMT Val/Met and COMT Met/Met group comparison (on the right), these changes were exhibited in a large area of the cortex predominantly localized in the frontal and temporal registration points, with a subtle tendency for a shift toward the right hemisphere. On the map these areas are partially overlapping. By contrast, for the COMT Val/Val and COMT Met/Met group comparison (on the left), changes in P300 were more localized in the temporal area of the right hemisphere.
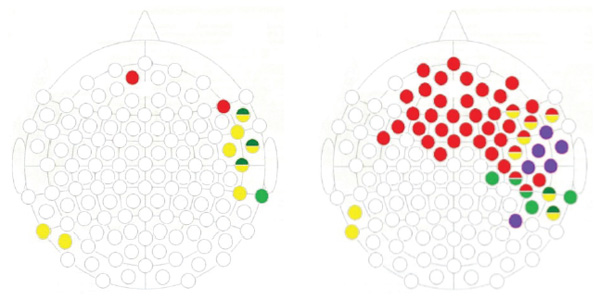
Figure 4. Registration points with significant differences in P300 amplitude (when the differences have a duration of 10 ms or more) in the ERPs to faces among different COMT genotypes carriers.
Note. On the left is the comparison between COMT Val-Val and COMT Met-Met; on the right is the comparison between COMT Val-Met and COMT Met-Met. The green color marks the points where the differences in responses to “positive” faces were found, red shows the “negative,” and yellow the “neutral” ones. The blue marks the electrodes where the reactions to all three types of stimuli were different.
In other words, this pattern of results suggests specifically that gene mutation by both alleles is implicated in the visual perception of emotionally charged facial expressions.
Visual perception of objects with different emotional valence
In Experiment Two, the participants’ task was to indicate what emotional response (positive, negative, or neutral – no emotional response) the target stimuli (images of objects) elicited in them.
As in the pattern of results for images of human faces, mutations of genes BDNF and HTR2A were not associated with significant changes in the ERPs. However, a comparison of the reactions of those in groups with different genotypes of the gene revealed significant changes in P300 amplitude. Figure 5presents, as an example, the ERPs in response to objects judged as eliciting negative emotions. Once again, in line with the findings for facial expressions, the P300 amplitude increases dramatically in observers with the Met/Met genotype.
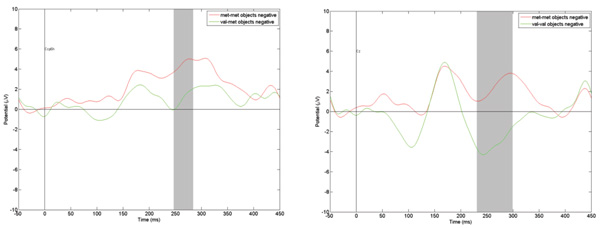
Figure 5. Comparison of ERPs in Fz registration point to “negative” objects among different COMT genotypes carriers. The gray vertical bar represents the time interval when amplitude difference is statistically significant (p < .01).
The same tendency is reflected in maps of potentials (see Figure 6)
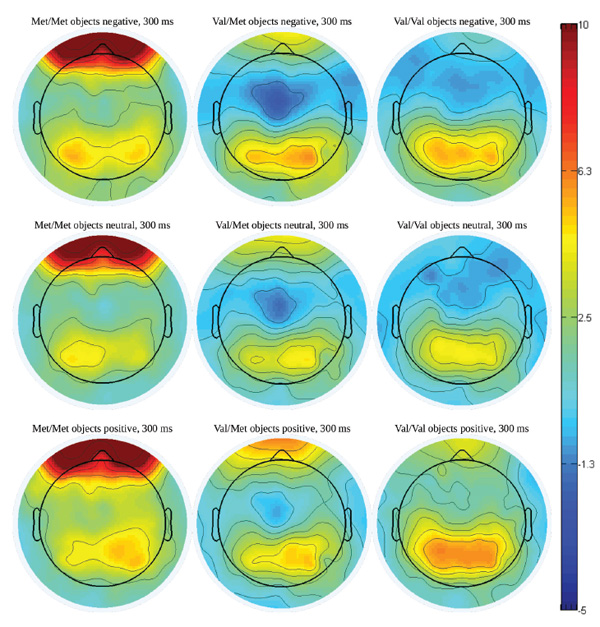
Figure 6. Potential maps with 300-ms latency in ERP to objects with various emotional valence among different COMT genotypes carriers.
It is quite noticeable that the maps for the COMT Val/Met and COMT Val/Val groups (middle and right columns) differ slightly, whereas reactions in the COMT Met/Met group (depicted in the column on the left) are significantly different from the reactions in both of other groups.
The next representation (see Figure 7) features registration points for which differences in perception of visual stimuli (objects) with various emotional valence among compared groups were discovered.
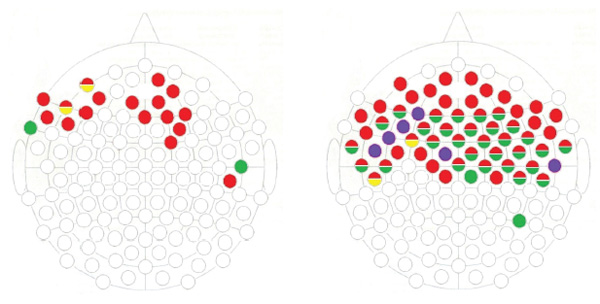
Figure 7. Registration points with significant differences in P300 amplitude (when the differences have a duration of 10 ms or more) in ERPs to objects among different COMT genotypes carriers.
Note. On the left is the comparison between COMT Val-Val and COMT Met-Met; on the right is the comparison between COMT Val-Met and COMT Met-Met. The green marks the points where the differences in responses to “positive” objects were found; red to the “negative.” and yellow to the “neutral” ones. The blue marks the leads where the reactions to all three types of stimuli were different.
As in the experiment with facial images,there were significantly more differences in the COMT Met/Met – COMT Val/Met pairwise group comparison than there were in the COMT Met/Met – COMT Val/Val group comparison, and changes in the P300 were found mainly in the frontal and temporal registration points. However, the shift to the right hemisphere is less obvious than in the above-mentioned.
Thus, the study results indicate that the genotype of the COMT gene, in particular, is implicated in the visual perception of stimuli with different emotional valences. Despite some specific differences between the tasks in Experiments One and Two, their respective patterns of results were largely similar. The main difference between the results of these two experiments was that the mutation of both alleles of the COMT gene was associated with even larger changes in evoked potentials for images of objects (Experiment Two) than for facial expressions (Experiment One), as reflected in the significant increase in the P300 amplitude.
Discussion
A comparison of the visual processing of neutral and emotionally charged stimuli shows that the latter elicit higher activation of the whole array of cortical and subcortical regions, including the amygdala and the prefrontal and visual cortex (Junghöfer, Bradley, Elbert, & Lang, 2001; Ohman & Mineka, 2001; Phan, Wager, Taylor, & Liberzon, 2002). Studies of the impact that emotionally charged visual stimuli have on ERP have a long and well-documented history (e.g., Codispoti, Ferrari, & Bradley, 2007; Eimer & Holmes, 2007; Hajcak, MacNamara, & Olvet, 2010; Herrmann et al., 2008; Olofsson, Nordin, Sequeira, & Polich, 2008). For that reason, our task was not to once again compare responses to stimuli with different emotional valence, but mainly to determine if polymorphism of certain genes affected the specifics of observers’ perception of visual stimuli of the same emotional type.
The results of both experiments (facial expressions and images of objects) were similar, despite a key difference in their respective tasks: perceiving clearly categorized emotional expressions (human faces) in Experiment One versus forming one’s own emotional response to otherwise unclassified visual images (pictures of objects) in Experiment Two. These different tasks, however, seemed to both evoke the same component of emotional empathy, indirectly indicating potential commonality in the respective underlying mechanisms. According to our results, in both cases the mutation of the COMT gene was specifically implicated in the particular ERPs.
The question then arises as to why this gene mutation would be responsible for changes in observers’ reactions to emotionally charged visual stimuli. There is a probability that the reason is connected to the fact that the COMT gene controls production of the ferment responsible for dopamine decomposition. The mutation of both alleles of the COMT gene leads to the reduced production of that ferment, and thus to an increase in dopamine levels. Given that dopamine is one of the key neural mediators managing human emotionality, the explanation appears to bear sufficient plausibility.
According to one of the reviews on the topic, mutations of the COMT genes may result in emotional deregulation (Barzman, Geise, & Lin, 2015). Furthermore, these findings describe the influence of mutations of both alleles that lead to specific changes in the neural network of emotional response and regulation, which in turn creates a possibility of development of affective psychopathology (Montag et al., 2008). In fact, it may reflect some kind of genetic predisposition for non-flexible processing of affective stimuli and be a potential threat of emotional deregulation (Drabant et al., 2006). For example, it has been shown that the bearers of the COMT Met/Met genotype manifested lower emotional stability when exposed to emotionally negative stimuli (Smolka et al., 2005).
Thus, we reiterate that it is plausible to suggest involvement of a mutation in both alleles of the COMT gene in shaping perception and the generation of human emotions.
The next question we attempted to address in the current study is why these relationships are primarily reflected in the P300. As some research has demonstrated, P300 is very sensitive to the state of the dopaminergic brain system (Nieuwenhuis, Aston-Jones, & Cohen, 2005; Polich, 2007). In other words, the genotype of the COMT gene determines characteristics of the dopaminergic system, which in turn influences P300 wave formation in response to emotionally charged stimuli, exactly as demonstrated in both experiments of the present study.
Why is the increase of P300 amplitude the most characteristic response to emotional stimuli in the case of the minor genotype of the COMT gene? It is customary to link characteristics of the P300 wave to dynamic characteristics of such complex cognitive processes as decision-making, planning, and voluntary attention (Gnezditsky, 2003). It has been established that an increase in dopamine levels in the prefrontal cortex accelerates cognitive processes. As a result, carriers of two mutant alleles of the COMT gene have a greater chance of successfully completing challenging cognitive tasks. Specifically, these carriers demonstrate higher information processing speed and attention capacity (Bilder et al., 2002). An increase in P300 amplitude, as observed in the current study, might exactly reflect these cognitive advantages.
However, people with the COMT Met/Met genotype could be less successful when the cognitive activity requires a rapid attention shift from one task to another (Rosa, Dickinson, Apud, Weinberger, & Elvevåg, 2010). According to data reported in yet another study (Alfimova, Golimbet, Lebedeva, Korovaitseva, & Lezheiko, 2014), such people are less efficient in dealing with processing emotionally charged images. Thus, we must ask: What is predominantly reflected in P300 amplitude increase? Is it the successful completion of an experimental task, or the complexity of this task and the difficulty of its resolution?
The comparative analysis hints at how observers from groups with different genotypes of the COMT gene classified the same set of objects by emotional valence (Figure 8). We recall that the objects in Experiment Two, in our judgment, could have been split more or less equally into categories potentially perceived by the observers as either emotionally charged (positive or negative), or emotionally neutral. We observed the following pattern of results. Groups COMT Val/Val and COMT Val/Met classified objects very similarly: approximately 40% were perceived as neutral, while the rest split roughly evenly as positive and negative. Quite a different result was recorded for the СОМТ Met/Met group: the proportion of objects classified as neutral was significantly higher there.
This outcome could be indicative of an elevated difficulty in determining the emotional valence of objects by the observers in that group. Such an explanation would be in line with some previous findings that demonstrated a lower capacity for the verbalization of emotions and feelings in carriers of the COMT Met/Met genotype (e.g., Swart et al., 2011).
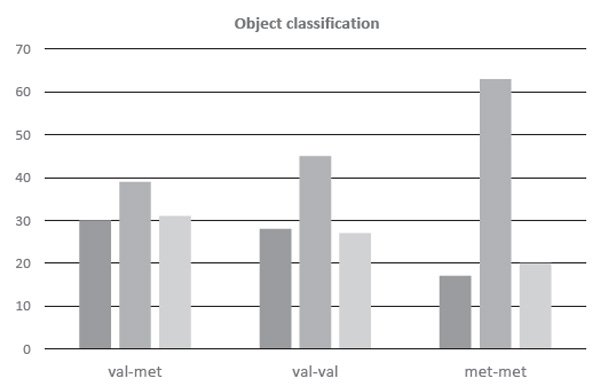
Figure 8. Percentage ratio (Y-axis) of objects with various emotional valence in groups with different COMT genotypes. The red bar represents the “negative” objects, yellow the “neutral,” and green the “positive” ones.
The study results allow us to suggest that the observed increase in P300 amplitude in representatives of the СОМТ Met/Met group was due to their struggle in differentiating emotionally charged stimuli. Indeed, it is known that, when the target stimulus is perceived by observers as neutral (emotionally indifferent), the P300 wave may not be generated. However, the more subjectively significant for the observer the stimulus is, the higher the P300 amplitude (Kropotov, 2010).
Conclusion
Our study has demonstrated that the polymorphism of BDNF and HTR2A genes does not affect perception of images containing emotional information. By contrast, it also demonstrated that mutations of both alleles of the COMT gene, which are responsible for elevated levels of dopamine in the brain, resulted in increased difficulty in making decisions about the emotional valence of visual stimuli, as reflected in the increase of P300 amplitude in the frontal, temporal, and parietal areas of the cerebral cortex. When the emotional expression is perceived, the area of ERP changes shifts toward the right hemisphere. When the observers assess the emotional valence of objects, an increase in amplitude of P300 occurs in both hemispheres.
This study was limited to only a few of the genes that could potentially influence the course of cognitive processes associated with the perception of the emotional content of images. Obviously, this list is not complete, and it is necessary to continue the search for genes associated with cognitive functions. In addition, it is important to pay attention to the possible linkage of these genes, when it is a certain combination of their mutations that gives a certain result.
Acknowledgements
Supported by Ministry of Education and Science of the Russian Federation, project No 25.3336.2017/ПЧ.
References
Alfimova, M.V., Golimbet, V.E., Lebedeva, I.S., Korovaitseva, G.I., & Lezheiko, T.V. (2014). Vliyanie trevozhnosti i gena COMT na vyzvannye potentsialy mozga i produktivnost’ izbiratel’nogo vnimaniya [Effects of anxiety and the COMT gene on cortical evoked potentials and performance effectiveness of selective attention]. Zh Vyssh Nerv Deiat I P Pavlova, 64(3), 270–278. https://doi.org/10.7868/S0044467714030034
Alfimova, M.V., Lezheiko, T.V., Golimbet, V.E., Korovaitseva, G.I., Lavrushina, O.M., Kolesina, N.Y., … Kaleda, V.G. (2008). Issledovanie svyazi polimorfnykh markerov genov mozgovogo neyrotroficheskogo faktora i retseptora serotonina tipa 2A s pokazatelyami proizvol’nogo i neproizvol’nogo zritel’nogo vnimaniya pri shizofrenii [Investigation of the association of the brain-derived neurotrophic factor (BDNF) and a serotonin receptor 2A (5-HTR2A) genes with voluntary and involuntary attention in schizophrenia]. Zhurnal Nevrologii i Psikhiatrii imeni S.S. Korsakova, 108(4), 62–69.
Bartoletti, A., Cancedda, L., Reid, S.W., Tessarollo, L., Porciatti, V., Pizzorusso, T., & Maffei, L. (2002). Heterozygous knock-out mice for brain-derived neurotrophic factor show a pathway-specific impairment of long-term potentiation but normal critical period for monocular deprivation. The Journal of Neuroscience: The Official Journal of the Society for Neuroscience, 22(23), 10072–10077. https://doi.org/10.1523/JNEUROSCI.22-23-10072.2002
Barton, B., Treister, A., Humphrey, M., Abedi, G., Cramer, S.C., & Brewer, A.A. (2014). Paradoxical visuomotor adaptation to reversed visual input is predicted by BDNF Val66Met polymorphism. Journal of Vision, 14(9). https://doi.org/10.1167/14.9.4
Barzman, D., Geise, C., & Lin, P.-I. (2015). Review of the genetic basis of emotion dysregulation in children and adolescents. World Journal of Psychiatry, 5(1), 112–117. https://doi.org/10.5498/wjp.v5.i1.112
Bilder, R.M., Volavka, J., Czobor, P., Malhotra, A.K., Kennedy, J.L., Ni, X., … Lieberman, J.A. (2002). Neurocognitive correlates of the COMT Val(158)Met polymorphism in chronic schizophrenia. Biological Psychiatry, 52(7), 701–707. https://doi.org/10.1016/S0006-3223(02)01416-6
Billino, J., Hennig, J., & Gegenfurtner, K.R. (2017). Association between COMT genotype and the control of memory guided saccades: Individual differences in healthy adults reveal a detrimental role of dopamine. Vision Research, 141, 170–180. https://doi.org/10.1016/j.visres.2016.10.001
Braddick, O., Atkinson, J., Akshoomoff, N., Newman, E., Curley, L.B., Gonzalez, M.R., … Jernigan, T. (2017). Individual differences in children’s global motion sensitivity correlate with TBSS-based measures of the superior longitudinal fasciculus. Vision Research, 141, 145–156. https://doi.org/10.1016/j.visres.2016.09.013
Bunyaeva, M.V., Kovsh, E.M., Skirtach, I.A., & Il’in, A.B. (2016). Otrazhenie sochetaniya genotipov po polimorfnym lokusam COMT Val158Met i MAOA -uVNTR v psikhologicheskikh osobennostyakh devushek [The reflection of the combination of genotypes of polymorphic loci of COMT VAL158MET and MAOA -uVNTR in psychological features of girls]. Russian Psychological Journal, 13(4), 218–231. https://doi.org/10.21702/rpj.2016.4.13
Codispoti, M., Ferrari, V., & Bradley, M.M. (2007). Repetition and event-related potentials: distinguishing early and late processes in affective picture perception. Journal of Cognitive Neuroscience, 19(4), 577–586. https://doi.org/10.1162/jocn.2007.19.4.577
Dai, W., Kaminga, A.C., Wu, X., Wen, S.W., Tan, H., Yan, J., … Liu, A. (2017). Brain-Derived Neurotropic Factor Val66Met Polymorphism and Posttraumatic Stress Disorder among Survivors of the 1998 Dongting Lake Flood in China. BioMed Research International, 2017, 1–9. https://doi.org/10.1155/2017/4569698
Deary, I.J. (2013). Intelligence. Curr Biol.,23(16), 673-676. https://doi.org/10.1016/j.cub.2013.07.021
Deary, I.J., Johnson, W., & Houlihan, L.M. (2009). Genetic foundations of human intelligence. Hum Genet., 126(1), 215-232. https://doi.org/10.1007/s00439-009-0655-4
Delorme, A., & Makeig, S. (2004). EEGLAB: an open source toolbox for analysis of single-trial EEG dynamics including independent component analysis. Journal of Neuroscience Methods, 134(1), 9–21. https://doi.org/10.1016/j.jneumeth.2003.10.009
Drabant, E.M., Hariri, A.R., Meyer-Lindenberg, A., Munoz, K.E., Mattay, V.S., Kolachana, B.S., … Weinberger, D.R. (2006). Catechol O-methyltransferase val158met genotype and neural mechanisms related to affective arousal and regulation. Archives of General Psychiatry, 63(12), 1396–1406. https://doi.org/10.1001/archpsyc.63.12.1396
Eimer, M., & Holmes, A. (2007). Event-related brain potential correlates of emotional face processing. Neuropsychologia,45(1), 15–31. https://doi.org/10.1016/j.neuropsychologia.2006.04.022
Fan, M., Li, R.H., Hu, M. S., Xiao, L.Y., Zhou, X.D., Ran, M.S., & Fang, D.Z. (2017). Association of Val66Met polymorphism at brain derived neurotrophic factor gene with depression among Chinese adolescents after the Wenchuan earthquake: An 18 months longitudinal study. Physiology & Behavior, 179, 16–22. https://doi.org/10.1016/j.physbeh.2017.05.018
Getzmann, S., Gajewski, P.D., Hengstler, J.G., Falkenstein, M., & Beste, C. (2013). BDNF Val66Met polymorphism and goal-directed behavior in healthy elderly - evidence from auditory distraction. NeuroImage, 64, 290–298. https://doi.org/10.1016/j.neuroimage.2012.08.079
Gnezditsky, V.V. (2003). Vyzvannye potentsialy mozga v klinicheskoy praktike [Evoked brain potentials in clinical practice]. Moscow: Medpress-Inform.
Golimbet, V.E., Volel, B.A., Dolzhikov, A.V., Korovaitseva, G.I., & Isaeva, M.I. (2014). Association of 5-HTR2A and 5-HTR2C Serotonin Reeptor Gene Polymorphisms with Depression Risk in Patients with Coronary Heart Disease. Bulletin of Experimental Biology and Medicine, 156(5), 680–683. https://doi.org/10.1007/s10517-014-2424-1
Grzeczkowski, L., Clarke, A.M., Francis, G., Mast, F.W., & Herzog, M.H. (2017). About individual differences in vision. Vision Research, 141, 282–292. https://doi.org/10.1016/j.visres.2016.10.006
Hajcak, G., MacNamara, A., & Olvet, D.M. (2010). Event-related potentials, emotion, and emotion regulation: an integrative review. Developmental Neuropsychology, 35(2), 129–155. https://doi.org/10.1080/87565640903526504
Harrison, P., & Tunbridge, E. (2008). Catechol-O-Methyltransferase (COMT): A Gene Contributing to Sex Differences in Brain Function, and to Sexual Dimorphism in the Predisposition to Psychiatric Disorders. Neuropsychopharmacol., 33, 3037–3045. https://doi.org/10.1038/sj.npp.1301543
Herrmann, M.J., Huter, T., Plichta, M.M., Ehlis, A.-C., Alpers, G.W., Mühlberger, A., & Fallgatter, A.J. (2008). Enhancement of activity of the primary visual cortex during processing of emotional stimuli as measured with event-related functional near-infrared spectroscopy and event-related potentials. Human Brain Mapping,29(1), 28–35. https://doi.org/10.1002/hbm.20368
Ji, H., Dai, D., Wang, Y., Jiang, D., Zhou, X., Lin, P., … Wang, Q. (2015). Association of BDNF and BCHE with Alzheimer’s disease: Meta-analysis based on 56 genetic case-control studies of 12,563 cases and 12,622 controls. Experimental and Therapeutic Medicine,9(5), 1831–1840. https://doi.org/10.3892/etm.2015.2327
Junghöfer, M., Bradley, M.M., Elbert, T.R., & Lang, P.J. (2001). Fleeting images: a new look at early emotion discrimination. Psychophysiology, 38(2), 175–178. https://doi.org/10.1111/1469-8986.3820175
Korte, M., Kang, H., Bonhoeffer, T., & Schuman, E. (1998). A role for BDNF in the late-phase of hippocampal long-term potentiation. Neuropharmacology, 37(4–5), 553–559. https://doi.org/10.1016/S0028-3908(98)00035-5
Kovsh, E.M. (2016). Psikhofiziologicheskie i psikhologicheskie osobennosti muzhchin i zhenshchin, nositeley polimorfizmov genov MAOA i SOMT, s raznym urovnem agressivnosti [Psychophysiological and psychological features of men and women with different polymorphisms of the MAOA and COMT genes and different levels of aggressiveness. PhD thesis]. Southern Federal University, Rostov-on-Don.
Kropotov, Y.D. (2010). Kolichestvennaya EEG, kognitivnye vyzvannye potentsialy mozga cheloveka i neyroterapiya [Quantitative EEG, cognitive evoked potentials of the human brain, and neurotherapy]. Donetsk: Publisher Zaslavsky A.Y.
Lebe, M., Hasenbring, M.I., Schmieder, K., Jetschke, K., Harders, A., Epplen, J.T., … Kötting, J. (2013). Association of serotonin-1A and -2A receptor promoter polymorphisms with depressive symptoms, functional recovery, and pain in patients 6 months after lumbar disc surgery. Pain, 154(3), 377–384. https://doi.org/10.1016/j.pain.2012.11.017
López-Alcón, D., Marín-Franch, I., Fernández-Sánchez, V., & López-Gil, N. (2017). Optical factors influencing the amplitude of accommodation. Vision Research, 141, 16–22. https://doi.org/10.1016/j.visres.2016.09.003
Lundqvist, D., Flykt, A., & Öhman, A. (1998). The Karolinska Directed Emotional Faces; A Validation Study. KDEF. Stockholm, Sweden: CD ROM from Department of Clinical Neuroscience, Psychology section, Karolinska Institutet. https://doi.org/10.1037/t27732-000
Montag, C., Buckholtz, J.W., Hartmann, P., Merz, M., Burk, C., Hennig, J., & Reuter, M. (2008). COMT genetic variation affects fear processing: psychophysiological evidence. Behavioral Neuroscience, 122(4), 901–909. https://doi.org/10.1037/0735-7044.122.4.901
Nieuwenhuis, S., Aston-Jones, G., & Cohen, J.D. (2005). Decision making, the P3, and the locus coeruleus-norepinephrine system. Psychological Bulletin, 131(4), 510–532. https://doi.org/10.1037/0033-2909.131.4.510
Notaras, M., Hill, R., & van den Buuse, M. (2015). A role for the BDNF gene Val66Met polymorphism in schizophrenia? A comprehensive review. Neuroscience and Biobehavioral Reviews, 51, 15–30. https://doi.org/10.1016/j.neubiorev.2014.12.016
Ohman, A., & Mineka, S. (2001). Fears, phobias, and preparedness: toward an evolved module of fear and fear learning. Psychological Review, 108(3), 483–522. https://doi.org/10.1037/0033-295X.108.3.483
Olofsson, J.K., Nordin, S., Sequeira, H., & Polich, J. (2008). Affective picture processing: an integrative review of ERP findings. Biological Psychology, 77(3), 247–265. https://doi.org/10.1016/j.biopsycho.2007.11.006
Olszanowski, M., Pochwatko, G., Kuklinski, K., Scibor-Rylski, M., Lewinski, P., & Ohme, R.K. (2015). Warsaw set of emotional facial expression pictures: a validation study of facial display photographs. Frontiers in Psychology, 5. https://doi.org/10.3389/fpsyg.2014.01516
Pantic, M., Valstar, M., Rademaker, R., & Maat, L. (2005). Web-Based Database for Facial Expression Analysis. 2005 IEEE International Conference on Multimedia and Expo, 317–321. https://doi.org/10.1109/ICME.2005.1521424
Park, H., & Poo, M. (2013). Neurotrophin regulation of neural circuit development and function. Nature Reviews. Neuroscience, 14(1), 7–23. https://doi.org/10.1038/nrn3379
Phan, K.L., Wager, T., Taylor, S.F., & Liberzon, I. (2002). Functional neuroanatomy of emotion: a meta-analysis of emotion activation studies in PET and fMRI. NeuroImage,16(2), 331–348. https://doi.org/10.1006/nimg.2002.1087
Plomin, R., & Deary, I.J. (2015). Genetics and intelligence differences: five special findings. Mol Psychiatry, 20(1), 98-108. https://doi.org/10.1038/mp.2014.105
Polich, J. (2007). Updating P300: an integrative theory of P3a and P3b. Clinical Neurophysiology: Official Journal of the International Federation of Clinical Neurophysiology, 118(10), 2128–2148. https://doi.org/10.1016/j.clinph.2007.04.019
Proenca, C.C., Song, M., & Lee, F.S. (2016). Differential effects of BDNF and neurotrophin 4 (NT4) on endocytic sorting of TrkB receptors. Journal of Neurochemistry, 138(3), 397–406. https://doi.org/10.1111/jnc.13676
Rosa, E.C., Dickinson, D., Apud, J., Weinberger, D.R., & Elvevåg, B. (2010). COMT Val158Met polymorphism, cognitive stability and cognitive flexibility: an experimental examination. Behavioral and Brain Functions : BBF, 6, 53. https://doi.org/10.1186/1744-9081-6-53
Smolka, M.N., Schumann, G., Wrase, J., Grüsser, S.M., Flor, H., Mann, K., … Heinz, A. (2005). Catechol-O-methyltransferase val158met genotype affects processing of emotional stimuli in the amygdala and prefrontal cortex. The Journal of Neuroscience: The Official Journal of the Society for Neuroscience, 25(4), 836–842. https://doi.org/10.1523/JNEUROSCI.1792-04.2005
Sparrow, J.E., LaBarre, J.A., & Merrill, B.S. (2017). Individual differences in motion-induced blindness: The effects of mask coherence and depth ordering. Vision Research, 141, 117–126. https://doi.org/10.1016/j.visres.2016.11.008
Sternberg, R.J. (2012). Intelligence. Dialogues Clin Neurosci., 14(1), 19-27. https://doi.org/10.1002/9781118133880.hop201009
Sujitha, S.P., Nair, A., Banerjee, M., Lakshmanan, S., Harshavaradhan, S., Gunasekaran, S., & Gopinathan, A. (2014). 5-Hydroxytryptamine (serotonin) 2A receptor gene polymorphism is associated with schizophrenia. The Indian Journal of Medical Research, 140(6), 736–743.
Sukhodol’skaya, E.M. (2016). Izuchenie allel’nogo polimorfizma genov neyromediatornykh sistem, assotsiirovannykh s povedencheskimi reaktsiyami [Study of allelic polymorphism of genes of neurotransmitter systems associated with behavioral reactions. PhD thesis.]. Institute of Gene Biology of the Russian Academy of Sciences, Moscow.
Švob Štrac, D., Pivac, N., & Mück-Šeler, D. (2016). The serotonergic system and cognitive function. Translational Neuroscience, 7(1), 35–49. https://doi.org/10.1515/tnsci-2016-0007
Swart, M., Bruggeman, R., Larøi, F., Alizadeh, B.Z., Kema, I., Kortekaas, R., … Aleman, A. (2011). COMT Val158Met polymorphism, verbalizing of emotion and activation of affective brain systems. NeuroImage, 55(1), 338–344. https://doi.org/10.1016/j.neuroimage.2010.12.017
Tunbridge, E.M., & Harrison, P.J. (2010). Importance of the COMT Gene for Sex Differences in Brain Function and Predisposition to Psychiatric Disorders. In: J. Neill & J. Kulkarni (Eds.),Biological Basis of Sex Differences in Psychopharmacology. Current Topics in Behavioral Neurosciences, 8. https://doi.org/10.1007/7854_2010_97
Vorobyeva, E., Ermakov, P.N., Kovsh, E.M., & Abakumova, I.A. (2017). Personality features of women-carriers of different diplotypes on polymorphic loci Val158Met COMT and –uVNTR MAOA. Behavior Genetics, 47(6), 672.
Witzel, C., O’Regan, J.K., & Hansmann-Roth, S. (2017). The dress and individual differences in the perception of surface properties. Vision Research, 141, 76–94. https://doi.org/10.1016/j.visres.2017.07.015
Zainullina, A.G., Valiullina, A.R., & Khusnutdinova, E.K. (2016). Rol’ geneticheskikh i sredovykh faktorov riska v formirovanii suitsidal’nogo povedeniya v khode razvitiya [The role of genetic and environmental risk factors in the aetiology of suicidal behaviour]. In S. B. Malykh, Y. B. Kovas, & D. A. Gaysina (Eds.), Behavioural genomics: child development and education(pp. 299–331). Tomsk: Tomsk State University.
To cite this article: Ermakov, P.N., Borokhovski, E.F., Babenko, V.V., Alekseeva, D.S., Yavna, D.V. (2020). The Influence of the Polymorphism of BDNF, HTR2A, and COMT Genes on the Perception of Emotionally Charged Images. Psychology in Russia: State of the Art, 13(2), 47-63.
The journal content is licensed with CC BY-NC “Attribution-NonCommercial” Creative Commons license.


