Psychophysiological traits of men with several genotypes in polymorphic locus Val158Met COMT and different levels of aggressiveness
Abstract
Background. The catechol-O-methyl transferase gene influences the reuptake of monoamines (dopamine, serotonin, noradrenaline) from the synaptic space. The structural peculiarities of this gene are linked with the duration of stay of neurotransmitters in the synaptic gap and the emergence and duration of emotional reactions, which may considerably affect a person’s level of aggressiveness; these peculiarities may manifest as psychophysiological characteristics.
Objective and design. This study investigated the amplitude, spatio-temporal traits and sources of evoked brain activity in men with several genotypes in the polymorphic locus Val158Met in the COMT (Catechol-O-methyl transferase) gene, levels of aggressiveness using the Buss-Darkee inventory, proneness to various types of deviant and addictive behaviors in accordance with the methods of A.N. Oryol and the preferred strategies of behavior during conflict in accordance with the methods of Kenneth Thomas. Statistical processing of psychodiagnostic data included dispersive (ANOVA) and discriminative analyses.
Results. This study found significant differences in the parameters of evoked brain activity components in responses to emotionally charged stimuli (“aggression”, “positive”, “tolerance”, “extremism, terrorism”) compared with neutral images. Student’s t-test (Holms- corrected for multiple comparisons) was used to analyze the EEG-VEP data.
Conclusion. This study confirmed the hypothesis of differences in spatio-temporal and amplitude parameters of evoked brain potentials in young men exhibiting differing levels of aggressiveness. The sources of evoked brain activity determined using sLORETA (Standardized Low-resolution Brain Electromagnetic Tomography) were different between carriers of different genotypes.
Received: 17.02.2017
Accepted: 04.05.2017
PDF: http://psychologyinrussia.com/volumes/pdf/2018_1/psych_1_2018_3.pdf
Pages: 32-44
DOI: 10.11621/pir.2018.0103
Keywords: aggressiveness, visual-evoked potentials, COMT, neurotransmitters, emotionally charged stimuli
Introduction
Comprehensive studies of personal traits, namely, interconnections between genetic, physiological and psychological characteristics, are currently of great interest. The structure of genes defines the activity of neurotransmitters and neurohormones, which significantly affects the synaptic contacts between various neuronal structures. Therefore, the concentration of neurotransmitters and the length of their staying in the synaptic space are associated with the peculiarities of information transfer from one brain region to another and the duration of reactions, which may manifest as the duration and the intensity of emotions (Brady, 2012).
Scientists are investigating the mechanisms of the above phenomena, and they are in search of candidate genes that underlie various psychological and psychophysiological functions. However, the accumulated material has not elucidated the genetic and psychophysiological substrates of psychological traits and the accompanying mechanisms. One area of special interest is the study of genetic bases and psychophysiological correlates of human aggressiveness because of the powerful destructive potential of an uncontrolled aggressive reaction. Aggressiveness is a personal biologically and socially based trait, and numerous scientists (e.g., Buckholtz & Meyer-Lindenberg, 2008; Eisenberger et al., 2007; Ermakov, 2014; Vorobyeva et al., 2016) have attempted to identify individual mechanisms of aggression. Several aggressive behavior candidate genes were revealed in recent years; J.W. Buckholtz and A. Meyer-Lindenberg (2008) identified the COMT (Catechol-O-methyltransferase) gene. Some recent investigations examined associations between COMT genotypes and the bioelectric activity of the cerebral cortex. M.V. Alfimova et al. (2014) demonstrated an association between COMT structure and selective attention productivity and anxiety level, which were reflected in the amplitude and temporal parameters of component N100; S.J. Tsai (2003) revealed an association between the structure of the COMT gene and success in intellect test performance and the latency of component P300; M.V. Alfimova et al. (2015) and G. Lelli-Chiesa et al. (2011) viewed images of different valences and arousal effects and discovered an association between COMT genotypes and the level of activation of certain brain structures; and M.N. Smolka (2005) reported an association between the COMT gene and the peculiarities of emotional tolerance. M.V. Alfimova and V.E. Golimbet (2011), and A. Meyer-Lindenberg et al. (2006) demonstrated psychophysiological correlates of emotiogenic stimuli processing in people with various levels of aggression. These correlates reflect emotional regulation and cognitive control processes, which suggests that they may function as a link in aggressive behavior formation.
However, the number of studies of the psychophysiological phenotypes, including aggressiveness, of people carrying various genotypes in the Vall58Met polymorphic locus of the COMT gene, remains low.
Method
The aim of this paper was to study the amplitude and spatio-temporal parameters, as well as to localize the sources of evoked brain activity in men with several genotypes in the polymorphic locus Vall58Met of the COMT gene who exhibited different levels of aggressiveness. The originality of this paper lies in its multifaceted approach to investigate the psychological and psychophysiological personal traits and the sources of evoked brain activity in carriers of various COMT genotypes.
The hypothesis of the study was that the amplitude and spatio-temporal characteristics of the evoked brain activity in men with several genotypes in the polymorphic locus Vall58Met COMT and different levels of aggressiveness were distinctly different. We also proposed that the sources of evoked brain activity were different in carriers of various COMT genotypes.
The subjects were right-handed males between 18 and 30 years of age who carried genotypes GG, AA, and GA of the COMT gene (40 people).
The psychogenetic stage of the research involved buccal epithelium sampling and genotype testing. DNA analysis was performed in the “High Tech” Shared Knowledge Center of Southern Federal University (Rostov-on-Don). DNA was extracted using “AmpliPrime DNK-sorb-AM” treatment agents (NextBio LLC, Russia); PCR was performed using the programmed thermostat “Tertsik” (DNK-Tekhnologiya, Russia); and the Vall58Met polymorphism of the COMT gene was analyzed using SNP-express agents (Litekh, Russia). Visualization was performed using a UF transilluminator GelDoc (Bio-Rad, USA).
The psychodiagnostic stage examined the aggressiveness level using the Buss-Durkee Hostility Inventory (1957) as adapted by A.K. Osnitsky in 1998. This inventory assesses personal inclinations to various aggression manifestations, summary aggressiveness and hostility indexes. Diagnostics of personal inclinations for deviant behavior were assessed using the inventory by A.N. Oryol (1999). Determinations of the strategies of behavior in conflict were conducted in accordance with the K.W. Thomas (1974) test.
Data of the psychodiagnostic stage of the experiment were analyzed using ANOVA, post-Hoc Fisher s analysis, and discriminant analysis followed by canonical analysis.
The psychophysiological stage included EEG recordings using 64 leads in monopolar mode with 2 referents (electroencephalograph Neurovisor-136, MKS, Russia). The NeoRec program was used to register EEG data. The EEGLab for Matlab package was used to process recordings, cut epochs, and detect visual-evoked potentials (VEPs). The analysis epoch was [-100; 600 ms]. The sLORETA program (http://www.uzh.ch/keyinst/loreta) was used to localize the sources of evoked brain activity.
Evoked potentials were recorded in response to emotionally charged and neutral visual stimuli. All images were arranged in the following groups: “aggression”, 4extremism, terrorism”, “tolerance”, “positive” and “neutral” using the expert evaluation method. Each group contained 110 to 115 images. The physical parameters of the visual stimuli (color, intensity, size, and contrast) were equal.
Students t-test (Holms-corrected for multiple comparisons) was used to analyze the evoked brain activity parameters. The evoked potentials recorded in each of the 64 leads of the carriers of several genotypes in response to different groups of stimuli were averaged. Evoked potential charts that reflected the peculiarities of the evoked brain activity in response to neutral stimuli and definite group stimuli were created. Students t-test revealed significant differences in the amplitude and latency parameters of evoked brain activity in a particular group of trial subjects.
The chosen calculation procedure preserved the individual peculiarities of evoked brain activity in the carriers of definite genotypes.
We used the R.D. Pascual-Marqui sLORETA (Standardized Low-resolution Brain Electromagnetic Tomography, 2002) method to determine evoked brain activity generators. The following data preprocessing was performed prior to application: the VEP parameters in response to neutral stimuli were subtracted from the VEP parameters obtained in response to emotionally significant images of the same test group; thus, the D-wave was analyzed (Ermakov & Kovsh, 2016; Yavna, Kupriyanov, & Kokornikova, 2016; Babenko & Ermakov, 2015; Halford, 2008).
Results
Psychological testing revealed that men with the high-activity genotype COMT (GG) were characterized by a low aggression index, which included low scores on the Physical Aggression and Negativism scales. Members of this group did not exhibit any inclination to aggression and violence, and they preferred a collaborative strategy when in conflict. Carriers of this genotype were generally characterized by a low aggressiveness level and commitment to productive collaboration (see Figure 1, 2; p<0.05).

Figure 1. The level and types of aggression in men with several genotypes in the polymorphic locus Vall58Met of the COMT gene (Post hoc Fisher analysis, LSD test)
Note:* — p<0.05
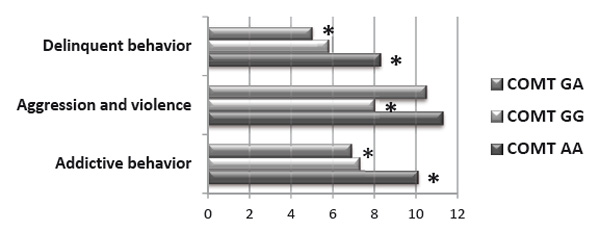
Figure 2. Manifestation of deviant behavior types in men with several genotypes in the polymorphic locus Vall58Met of the COMT gene (Post hoc Fisher analysis, LSD test)
Note:* — p<0.05
Men with the low-activity genotype COMT (AA) were characterized by high negativism and physical aggression level. They were inclined to addictive, delinquent behavior patterns, and aggression actualization in their spontaneous behavior. Members of this group were generally characterized by a high aggressiveness level and commitment to deviant behavior (see Figures 1, 2; p<0.05).
Men with the heterozygous genotype COMT (GA) were characterized by a high level of verbal aggression and high aggression index, but they were not inclined to violate social norms and rules (see Figures 1, 2; p<0.05).
These data suggest that the A allele of the COMT gene is associated with a high aggressiveness level.
Peculiarities of evoked brain activity in men with several COMT genotypes
Carriers of genotype GG COMT exhibited small significant differences (p<0.05) in amplitude and spatio-temporal characteristics, as well as in the sources of evoked brain activity while viewing emotionally charged images compared with neutral images.
Test observers exhibited more intensive brain activation during their assessments of the aggression group images compared to neutral images, which manifested as a greater positive wave amplitude in the range of the 350th ms (P300 component group) in central leads, with left-side asymmetry of brain activity. The N250 component was expressed in the frontal and central regions during the assessment of both stimuli groups.
The “Standardized Low-resolution Brain Electromagnetic Tomography” method revealed that the principal source of evoked brain activity in men with genotype GG COMT was the left temporal region (40th field, ac. to Brodmann) when viewing aggressive images. At the same time, there were no sources of VEP, located in the frontal regions (see Figure 3).
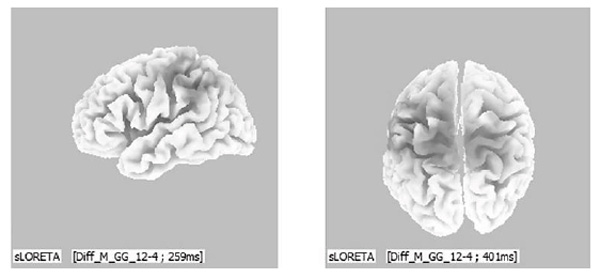
Figure 3. 3D localization of the evoked brain activity sources in response to the “aggression” group stimuli (men with genotype GG of the COMT gene), D-wave, 260-400 ms
Analysis of the parameters of evoked brain activity in response to the “positive" group stimuli compared to neutral stimuli revealed a greater amplitude of positive components in the range of the 150th, 350th, 600th ms in frontal brain regions; posterior regions of both hemispheres exhibited a greater amplitude of component N170 and greater latency of component P2 (see Figure 4). Analysis of the evoked activity sources suggests that the same structures participated in the generation of evoked activity in response to neutral and positively charged stimuli in men with genotype GG.

Figure 4. VEPs in different brain regions in response to “positive” and “neutral” images in men with genotype GG in polymorphic locus Vall58Met COMT, latent time 150-580 ms
Note: The (*) symbol in the electrodes location scheme indicates significant differences in the evoked activity in brain regions in response to the stimuli of the above categories, p<0.05. Vertical lines indicate significant differences between the VEP components in response to neutral (dotted line) and “aggressive” (continuous line) stimuli, p<0.05.
No significant differences in the parameters of evoked brain activity in response to images in the “tolerance” group compared to neutral images were revealed in men with genotype GG COMT. Notably, negativity growth was observed in the range of the 250th ms (amplitude growth of component N250) in frontal, frontal-central and central brain regions. Assessment of the density of the distribution of the sources of evoked brain activity while viewing images in this category demonstrated that the main VEP generator appeared in the 11th field (ac. to Brodmann) in the right hemisphere in the range of the 116th ms. The source of activity was the 40th field in the left hemisphere in the 527th ms, and the source was located in the parietal regions of both hemispheres in the 574th ms.
The psychophysiological reaction that accompanied the assessment of the “extremism, terrorism” stimuli did not differ from the reaction in response to neutral stimuli in carriers of this genotype. A distinct P300 wave peak was conspicuously absent, which may be related to the complexity of categorizing the stimuli of this group, as stated by J. Polich (2012). The principal sources of evoked activity in the assessment of the ‘extremism, terrorism” group images were the 21st and 39th fields of the left hemisphere.
Distinct differences were observed in the components of evoked brain activity in response to emotionally charged stimuli compared to neutral images in carriers of the genotype AA COMT. The 7th, 10th, 21st, and 38th fields (ac. to Brodmann) exhibited the greatest VEP generation, which reflects the involvement of the limbic cortex and tertiary sections that analyze emotional and cognitive stimuli processing (see Figure 5).

Figure 5. 3D localization of the evoked brain activity sources in response to the “aggression” group stimuli (men with genotype AA of the COMT gene), D-wave, 136-170 ms
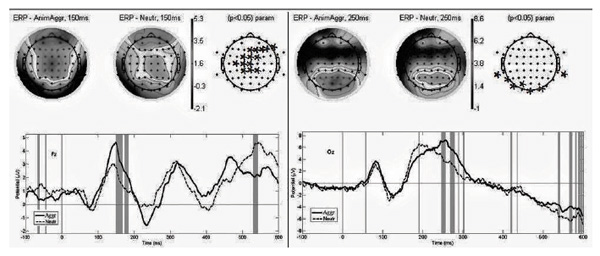
Figure 6. VEPs in different brain regions in response to 4 aggressive” and “neutral” images of men with genotype AA in polymorphic locus Vall58Met COMT, latent time 150; 250 ms
Note: The (*) symbol in the electrodes location scheme indicates significant differences in the evoked activity in brain regions in response to the stimuli of the above categories, p<0.05. Vertical lines indicate significant differences between the VEP components in response to neutral (dotted line) and “aggressive” (continuous line) stimuli, p<0.05.
Analysis of the evoked brain activity in genotype AA COMT carriers in response to the “aggression” group stimuli revealed greater amplitude and a latent time of component PI50, which may be related with attention arresting, according to D. Talsma et al. (2007) and L.I. Aftanas et al. (2001) — with an intensive emotional reaction while viewing the stimuli of this group. The above peculiarities did not manifest during the neutral images. The sources of this VEP component were frontal, parietal and associative regions. Significant differences (p < 0.05) were also revealed between the characteristics of component P2 registered bilaterally in the posterior brain regions. These differences manifested as greater latent times and reduced amplitudes of the described component in response to the “aggression” group stimuli, which may reflect a more intensive attention focusing on emotionally charged stimuli, according to J.K. Olofsson et al. (2008). No significant differences were discovered in the later component parameters (see Figure 6). The sources of evoked brain activity in the range of the 286th ms were frontal and posterior regions of the right hemisphere, which may be due to the negative nature of the emotions and the cognitive processing of the visual modality stimuli. The sources of activity in the 387th ms were the parietal regions of both hemispheres, which may reflect analytical and synthetic brain activity.
Notably, significant differences (p < 0.05) in evoked brain activity parameters during the first 400 ms after a stimulus presentation were largely focused in the neuronic structures of the right hemisphere, which may be related to non-conscious (intuitional) assessments of stimuli. The most intensive activity after the 400th ms was recorded in the prefrontal regions of the left hemisphere, which may reflect the rationalization of an early intuitional assessment and follow stimulus categorizing, according to M.N. Rusalova (2004).
Evoked brain activity in men with genotype AA was characterized by expressed positive components PI50, P300, and P500 while viewing emotionally charged and neutral stimuli. This fact may be related with a high intensity of cognition while processing stimuli with different emotional valences. According to J. Gallinat et al. (2003), this process may be explained by long presence of dopamine in the prefrontal regions. The greatest density of the sources of evoked activity was focused in the prefrontal region of the right hemisphere (8th field), prefrontal convexital region of the left hemisphere (10th field) and parietal regions of both hemispheres (7th field).
In the“positive” group stimuli assessment, Greater amplitudes of the PI 00 and P500 components in the frontal-central regions and greater negativity in component N170 with a reduced amplitude of component P2 in the parietal-occipital regions were noted; A.A. Kovalenko and V.B. Pavlenko (2009) suggest that these results indicate greater efficacy of selective attention and recognition of different image elements and idea formation on the basis of recollections actualized in memory in response to the “positive” group stimuli compared to neutral images. The sources of evoked activity during the middle stages of stimuli assessment were the prefrontal regions of both hemispheres, and the greatest density of the sources of evoked potentials during later stages was focused in the parietal regions of both hemispheres and the prefrontal region of the right hemisphere.
Evoked brain activity in the carriers of genotype AA COMT in response to the “tolerance” group stimuli compared to the parameters of reactions to neutral stimuli was characterized by a greater amplitude of components PI50 and N2 in the frontal-central and central regions of both hemispheres; this activity may reflect the attraction of voluntary attention followed by an expressed emotional reaction. Evoked activity of posterior brain regions was characterized by a reduced amplitude of component P2. The peculiarities of the density distribution of the evoked activity sources should be noted because of the semantic complexity of these stimuli. VEP generation occurred in the prefrontal and temporal regions of the left hemisphere (the 21st and 38th fields, ac. to Brodmann). The basic evoked activity source at the stage of cognitive stimuli processing (starting with the 300th ms) was the right hemisphere, and the density of the sources was distributed between the frontal and temporal regions of both hemispheres starting at the 350th ms.
Assessment by carriers of genotype AA COMT of the “extremism, terrorism” group stimuli revealed the following peculiarities: a greater amplitude of peak N250 in the central-parietal regions and a reduced amplitude of component N400 in the frontal regions. The sources of activity were the 8th and 40th fields (ac. to Brodmann).
Analysis of the evoked brain activity peculiarities in observers with genotype GA COMT revealed the absence of shaped component PI00 while visualizing negatively charged stimuli (“aggression”, “extremism, terrorism”) and the same response to images in the “positive” and “tolerance” groups. Cognitive component P300 was expressed in response to the “aggression” and “positive” group stimuli, and it was absent in response to stimuli with greater semantic complexity (i.e., “tolerance”, “extremism, terrorism”). The dominant role in the generation of evoked brain activity in this genotype carriers occurred in the left hemisphere structures, which suggests a discrete mechanism for the processing of emotionally charged stimuli (see Figure 7).
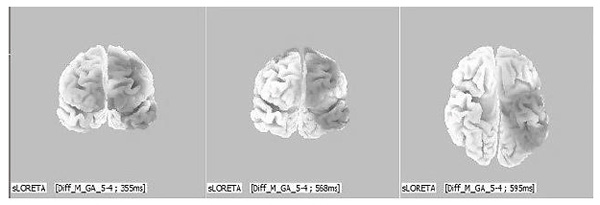
Figure 7. 3D localization of evoked brain activity sources in response to “positive” group stimuli (men with genotype GA of the COMT gene), D-wave, 355-600 ms
Reduction in the amplitude of component P200 in the occipital regions and the growth of positive wave amplitude in the range of the 300th ms in the frontalcentral regions were noted while visualizing “aggression” group stimuli compared to neutral images. The greatest density of VEP sources was focused in the prefrontal and temporal regions of the left hemisphere and the parietal regions of both hemispheres.
We observed greater negativity of component N1 while visualizing “positive” group stimuli, which may reflect face recognition activation. The cognitive processing of stimuli was reflected in greater positivity in the range of the 350th ms in the frontal-central regions. Significantly greater amplitude of the late positive wave in the temporal-parietal-occipital zone (TPO) of the right hemisphere was also observed in the range of the 600th ms, which may reflect a more effective categorization of the stimuli of this group compared to the neutral stimuli group. The sLORETA results suggest that the perception of emotionally charged visual stimuli involves the frontal and temporal regions of the left hemisphere and the limbic cortex of both hemispheres.
Evoked brain activity in response to “tolerance” group stimuli was characterized by greater amplitude of component N2 in the TPO zone of the right hemisphere. The positive wave reflected that cognitive processing of the stimuli of this group was formed with great delay, as late as the 600th ms, which may be due to the complexity of categorizing these images.

Figure 8. VEP in different brain regions in response to the ‘extremism, terrorism” and “neutral” images of men with genotype GA in polymorphic locus Vall58Met COMT, latent time 250, 500 ms
Note:The (*) symbol in the electrodes location scheme indicates significant differences in the evoked activity in brain regions in response to stimuli of the above categories, p<0.05. Vertical lines indicate significant differences between the VEP components in response to neutral (dotted line) and “aggressive” (continuous line) stimuli, p<0.05.
There were no significant differences in the amplitude and latency characteristics of evoked brain activity in male carriers of genotype GA COMT while visualizing images of the “extremism, terrorism” group. However, component N250 was expressed in the frontal and central brain regions, and positive peaks corresponding to the early, middle and late stages of stimuli processing were recorded in the central-parietal regions of both hemispheres in response to images of both groups (see Figure 8). The neuronal ensembles that actively participated in VEP generation in response to images in the "extremism, terrorism” group were located in the prefrontal, temporal and parietal regions of the left hemisphere with involvement of the 10th-11th fields of the right hemisphere.
Conclusion
The results of this investigation support the following conclusions of the psychophysiological traits of men who exhibit different aggressiveness levels and carry different genotypes in polymorphic locus Vall58Met of the COMT gene.
-
Carriers of genotype GG COMT were characterized by a low level of aggressiveness and were inclined to collaboration in conflict. The greatest density of the sources of evoked activity in response to emotionally charged stimuli was focused in the temporal region of the left hemisphere. Representatives of this group best differentiated the “positive” group images from the neutral stimuli, which was reflected in the parameters of the evoked brain activity.
-
Carriers of genotype AA COMT were characterized by a high level of aggressiveness and inclination to addictions. Generators of evoked brain activity in response to emotionally charged stimuli were located in the prefrontal and parietal regions of both hemispheres, which may be due to the alternating of emotionally charged, intuitive and rational assessments. Intensive activation of the limbic structures may explain the expressed VEP waves, which corresponded to different stages of the stimulus emotional assessment in neutral and emotionally charged image visualization. Distribution of activity sources between structures of the right and left hemispheres promotes a more effective processing of new stimuli.
-
Carriers of genotype GA COMT were characterized by a high level of aggressiveness, but these men were not inclined to deviant behavior patterns. Assessment of different emotionally charged images was followed by left-side asymmetry of the evoked activity sources with the involvement in its generation of the temporal-occipital region of the right hemisphere, which suggests a dominating discrete mechanism of information processing and a rational, conscious approach to the assessment of emotionally charged stimuli. Analysis of the amplitude-time VEP characteristics demonstrated that the above approach was ineffective because the evoked brain activity charts of the carriers of this genotype practically did not reflect any differences in the VEP parameters in response to neutral and emotionally charged images.
Therefore, the hypothesis of significant differences in the amplitude and spatiotemporal characteristics of evoked brain activity in men carrying various genotypes in polymorphic locus Vall58Met COMT with different aggressiveness levels was confirmed. Our supposition of different localizations of the evoked brain activity sources in carriers of different COMT genotypes was also confirmed, which suggests definite peculiarities in the cerebration of carriers of COMT genotypes who exhibit different aggressiveness levels. The obtained results serve as a basis for further investigation of the specificities of bioelectric brain activity and distribution of its most active sources, which mediate the influence of genes on behavior. The results of these studies will reveal the endophenotypes of aggressiveness.
Acknowledgements
This investigation was performed with financial support from the Russian Science Foundation (project No. 213.01-03/2016-4,agreement No. 16-18-10222).
References
Aftanas, L.I., Varlamov, A.A., Pavlov, S.V., Makhnev, V.P., & Reva, N.V. (2001). Affective picture processing: event-related synchronization within individually defined human theta band is modulated by valence dimension. Neuroscience Letters, 303(2),115-118. doi: 10.1016/ s0304-3940(01)01703-7
Alfimova, M.V., & Golimbet, V.E. (2011). Geny i neirofiziologicheskiye pokazateli kognitivnykh protsessov: obzor issledovaniy [Genes and neurophysiological indicators of cognitive processes: A review]. Zhurnal vysshey nervnoy deyatelnosti im. I.P. Pavlova [LP Pavlov Journal of Higher Nervous Activity],61(4), 389-401.
Alfimova, M.V., Golimbet, V.E., Lebedeva I.S., Korovaytsceva G.I., & Lezheyko T.V. (2014). Vliyanie trevozhnosti i gena COMT na vyzvannye potentsialy mozga i produktivnost izbiratelnogo vnimaniya [Effects of anxiety and the COMT gene on cortical evoked potentials and performance effectiveness of selective attention]. Zhurnal vysshey nervnoy dejatelnosti im. I.P. Pavlova [I.P. Pavlov Journal of Higher Nervous Activity], 64(3),270. doi:10.7868/ S0044467714030034
Alfimova, M.V., Melnikova, T.S., & Golimbet, V.E. (2015). Molekulyarno-geneticheskiye i elektroencefalograficheskiye markery kognitivnykh protsessov pri depressivnykh rasstroystvakh [Molecular-genetic and electroencephalographic markers of neurocognitive processes in depressive disorders]. Zhurnal nevrologii ipsikhiatrii [S.S. Korsakov Journal of Neurology and Psychiatry],115(5), 103-109.
Babenko, V.V., & Ermakov, P.N. (2015). Specificity of brain reactions to second-order visual stimuli. Visual Neuroscience, 32, E011. doi: 10.1017/s0952523815000085
Brady, S.T. (Ed.). (2012). Basic neurochemistry: Principles of molecular, cellular and medical neurobiology. Academic Press, doi: 10.1212/wnl.39.3.460-b
Buckholtz, J.W., & Meyer-Lindenberg, A. (2008). MAOA and the neurogenetic architecture of human aggression. Trends in Neurosciences, 31(3), 120-129. doi: 10.1016/j.tins.2007.12.006
Buss, A.H., & Durkee, A. (1957). An inventory for assessing different kinds of hostility. Journal of Consulting Psychology, 21(4),343. doi: 10.1037/h0046900
Eisenberger, N., Way, B.M., Taylor, S.E., Welch ,W.T., & Lieberman, M.D. (2007). Understanding genetic risk for aggression: Clues from the brains response to social exclusion. Biological Psychiatry, 61,1100-1108. doi: 10.1016/j.biopsych.2006.08.007
Ermakov, P.N. (2014). Hemispheric asymmetry of aggressive behavior and hereditary factors. International Journal of Psychophysiology, 2,143. doi: 10.1016/j.ijpsycho.2014.08.654
Ermakov, P.N., & Kovsh, E.M. (2016). Research of visual evoked potentials (VEPs) to emotionally charged stimuli in men with different levels of aggression. International Journal of Psychophysiology, 10S,69. doi: 10.1016/j.ijpsycho.2016.07.445
Gallinat, J., Bajbouj, M., Sander, T, Schlattmann, R, Xu, K., Ferro, E.F., Goldman, D., & Winterer, G. (2003). Association of the G1947A COMT (Val(108/158)Met) gene polymorphism with prefrontal P300 during information processing. Biological Psychiatry, 54,40-48. doi: 10.1055/S-2003-825332
Kovalenko, A.A., & Pavlenko, V.B. (2009). Emotsionalnaya znachimost stimula i cherty lichnosti: otrazheniye v patterne vyzvannykh EEG-potentsialov [Emotional significance of the stimulus and features of the personality as factors reflected in the pattern of evoked EEG potentials. Nejrofiziologiya [Neurophysiology], 41(4),336-356.
Lelli-Chiesa,G., Kempton, M.J., Jogia, J., Tatarelli, R., Girardi, R, Powell, J., Collier, D.A., & Frangou, S. (2011). The impact of the Vall58Met catechol-O-methyltransferase genotype on neural correlates of sad facial affect processing in patients with bipolar disorder and their relatives. Psychological Medicine, 41,779-788. doi: 10.1017/s0033291710001431
Loreta “Low Resolution Brain Electromagnetic Tomography”. Retreived from http://www.uzh.ch/keyinst/loreta
Meyer-Lindenberg, A., Buckholtz, J.W., Kolachana, B., Hariri, A.R., Pezawas, L., & Blasi, G. (2006). Neural mechanisms of genetic risk for impulsivity and violence in humans. Proceedings of the National Academy of Sciences, 103,6269-6274. doi: 10.1176/foc.4.3.360
Olofsson, J.K., & Polich, J. (2007). Affective visual event-related potentials: Arousal, repetition, and time-on-task. Biological Psychology, 75(1), 101-108. doi: 10.1016/j.biopsycho.2007.11.006
Oryol, A.N. (1999). Metodika diagnostiki sklonnosti к otklonyayushchemusya povedeniyu. Rukovodstvo [The technique of diagnostics of tendency to deviant behavior. Guide]. Yaroslavl, Russia: NPTs Psihhodiagnostika.
Pascual-Marqui, R.D. (2002). Standardized low resolution brain electromagnetic tomography (sLORETA): Technical details. Methods & Findings in Experimental & Clinical Pharmacology, 24D,5-12.
Polich, J. (2012). Neuropsychology of P300. In Oxford handbook of event-related potential components. (pp. 159-188). Oxford University Press, doi: 10.1093/oxfordhb/9780195374148.0 13.0089
Rusalova, M.N. (2004). Funktsionalnaya asimmetriya mozga: emotsii / Funktsionalnaya mezhpolusharnaya asimmetriya [Functional brain asymmetry: Emotions / Functional hemispheric asymmetry]. In N.N. Bogolepova & V.F. Fokina (Eds.), Khrestomatiya [Reader], (pp. 322-348). Moscow: Nauchniy mir.
Smolka, M.N., Schumann, G., Wrase, J., Griisser, S.M., Flor, H., Mann, K., & Heinz, A. (2005). Catechol-O-methyltransferase vall58met genotype affects processing of emotional stimuli in the amygdala and prefrontal cortex. The Journal of Neuroscience, 25(4), 836-842. doi: 10.1523/jneurosci. 1792-04.2005
Talsma, D., Mulckhuyse, M., Slagter, H.A., & Theeuwes, J. (2007). Faster, more intense! The relation between electrophysiological reflections of attentional orienting, sensory gain control, and speed of responding. Brain Research, 1178, 92-105. doi: 10.1016/j.brainres.2007.07.099
Thomas, K.W. (1974). Thomas-Kilmann conflict mode instrument.Tuxedo, NY: Xicom. doi: 10.1037/Ш2326-000
Vorobyeva, E.V., Kovsh, E.M., & Yavna, D.V. (2016). Visual evoked potentials elicited by culturally-specific images in women with different levels of hostility. International Journal of Psychophysiology, 108, 69. doi: 10.1016/j.ijpsycho.2016.07.225
Yavna, D.V., Kupriyanov, I.V., & Kokornikova, V. I. (2016). Otrazhenye protsessov vospriyatiya modulyaciy orientatsii v vyzvannykh otvetakh mozga cheloveka [The perception of the orientationally modulated textures and its expression in the visual evoked potentials]. Rossiyskiy psikhologicheskiy zhurnal [Russian psychological journal], 12(4),161-174.
To cite this article: Ermakov P.N., Abakumova I.V., Kovsh E.M. (2018). Psychophysiological traits of men with several genotypes in polymorphic locus Val158Met COMT and different levels of aggressiveness. Psychology in Russia: State of the Art, 11 (1), 32-44.
The journal content is licensed with CC BY-NC “Attribution-NonCommercial” Creative Commons license.


