Character and temperamental determinants of prosodic parameters of natural speech
Abstract
The study was undertaken to find relationships between personality and temperamental traits (estimated with the help of the Adult Personality Traits Questionnaire by Manolova, Leonhard and the Russian version of the Structure of Temperament Questionnaire (STQ) by Rusalov V. & Trofimova I. (2007)) on the one hand, and parameters of intonation (mean ΔF0, tone span, speech rate, duration of speech and mean duration of syllables interval) on the other hand. The parameters of intonation were measured on sample recordings produced by 30 male and female participants. 60 recordings of natural monologues on proposed topics were obtained in situations of the presence and absence of a conversation partner. Demostrativity (as a personality trait according to Leonhard’s typology) was found to significantly affect mean ΔF0, tone span and speech rate in the presence of an interlocutor. Social Tempo (as a dimension of temperament according to Rusalov’s model) affects the speech rate. In the absence of an interlocutor, only an interaction effect of Demonstrativity and Communication Activity on the same group of vocal parameters was obtained. The presence of an interlocutor proved to be a special condition for the most explicit appearance of Demonstrativity. Temperamental indices that describe the Communication realm seem to moderate the appearance of Demonstrativity in different conditions. Most explicitly, the key feature of people with strong Demonstrativity is a high speech rate.
Received: 02.10.2013
Accepted: 13.11.2013
Themes: Personality psychology
PDF: http://psychologyinrussia.com/volumes/pdf/2013_3/2013_3_95-106.Pdf
Pages: 95-106
DOI: 10.11621/pir.2013.0309
Keywords: Prosody, voice analysis, speech communication, temperament, personality traits.
The concept of intonation
The linguistic tradition of studying prosody considers the vocal aspect of human speech as a set of individual characteristics of pronunciation: speech tempo, voice timbre, and intonation itself. By intonation, “pronunciation-hearing expression of different intellectual or emotional-volitional meanings without the use of lexical media (i.e. the verbal structure of a phrase) by creating the acoustic structure of the whole phrase, its specific stressed periods, or a special way of saying particular words (intonation pattern)” (Bernshtein, 1996, p. 124) is meant.
In order to analyze the phenomenon described by the term “intonation”, different concepts, such as “intonation element” (Tseplitis, 1974), “intonation unit” (Sher- ba, 1958, cit. ex. Svetozarova, 1982), models of Russian intonation (e.g. (Kodzasov, 1999) and the so-called intonation language (Cheremisina, 1982, Blinova, 2001, Grigor’eva, 1999) have been created and developed. These concepts define intonation as a tool used by humans to create or further develop the meaning of a verbal utterance (Tseplitis, 1974, Kazannikova, 2003), which has a certain physiological basis (Cheremisina, 1982) as well as an ancient socio-cultural background (Makarova, 2007, Kushnir, 1990). Thus, it is the tool that, where there is an opportunity for a person to speak, is always used for achieving communication and verbal thinking goals if theу are connected with the necessity of oral speech.
In our research, intonation is regarded as a vocal characteristic of speech which is, in its formal and dynamic aspect, used by the individual to achieve a wide variety of communication goals, including making a certain impression on the interlocutor, convincing a person or an audience, etc. Therefore, our approach follows the tradition of research psychologists who study the correlation between speech and character (Belovol, 1999, Manerov, 1997, Ramsay 1968).
Acoustic correlates of intonational features of speech
The vocal aspect of speech that is referred to in various studies as “prosody” or “intonation” includes some characteristics that can change considerably over time, as well as ones that are quite constant. The latter are mainly of interest to research psycholo- gists searching for samples of individual style of oral speech, which can be described by acoustic parameters (Belovol, 1999, Feldstein & Sloan, 1984, Vitt, 1991).
Acoustic parameters can be divided into two major groups. The first group comprises parameters describing tonal characteristics of speech. By their means, researchers try to describe the melodic, or intonation, aspect of speech, examining the intonation patterns of human speech and the frequency range of the speaker’s voice. The most frequently used tone indices are: average frequency of the main tone — F0, in Hz (Mallory and Miller, 1958, cit. ex: Feldstein et al., 1984, Aronovitch, 1976, Keller, 2005, Reissland, Shepherd & Herrera, 2003), average F0 in semitones (Keller, 2005), minimal and maximal F0 (Reissland et al., 2003), tone span, i.e. the difference between maximal and minimal F0 (Tolkmitt & Scherer, 1986, Belovol, 1999), average ∆F0, i.e. the difference between two successive measurements of F0 (Keller, 2005), and particular intonation patterns of speech fragments (Ramsay, 1968, Keller, 2005, Frick, 1985).
The second group of acoustic indices comprises the temporal aspect of oral speech, namely: speech tempo measured as the number of syllables uttered per second (Aronovitch, 1976, Steer, 1974, Ramsay, 1968, Gawda, 2007, Markel et. al., 1972, cit. ex: Feldstein et al., 1984), speech tempo measured as the number of words per minute, words per half minute, and syllables per minute (Goldman-Eisler, 1954, Street & Brady, 1982, — cit. ex: Feldstein et al., 1984], sound/silence ratio (Aronovitch, 1976, Ramsay, 1966, Goldman-Eisler, 1951, cit. ex: Ramsay, 1968, Be- lovol, 1999), average length of a phrase, average duration of pauses in an utterance, and average duration of a phrase, including each pause after an utterance (Ramsay, 1968).
On the basis of the characteristics mentioned above, we have selected 5 indices that describe tonal variability, in order to achieve the goals of our study. They are: average ∆F0 and Tone Span, as well as temporal characteristics of speech: average duration of a syllable (indicates the rhythm of speech), overall tempo, and general duration of speech, which show how long a person is ready to discuss a particular theme in the absence of time limitations.
Psychological research of the intonation phenomena of speech
Numerous studies have been conducted in the psychodiagnostic approach. After summarizing a number of previous studies, Feldstein S. et al. (1984) set the task of searching for specific vocal parameters that are connected with personality traits, and experimentally confirmed that extraversion/introversion is connected with speech tempo. These authors, as well as previously Steer B. (1974), have also convincingly demonstrated the existence of an individual rhythm of speech that does not depend on the verbal task. While trying to confirm the previous findings, Gawda B. (2007) found a correlation between extroversion and neuroticism, on the one hand, and fluency of speech on the other.
The next landmark in this area of research was the work of Belovol E. (1999), based on today’s most modern structure model of formal-dynamical individual characteristics by Rusalov V. et all (1997, 2007), in which she discovered a number of correlations between acoustic parameters and temperamental characteristics. Thus, it was found that tonal characteristics of speech in different oral tasks are connected with all dimensions of the temperament (tempo, plasticity, ergonicity, emotionality) that appears in all types of activities (social, intellectual and motor).
Studies into the effects of subclinical depression on oral speech characteristics, in the case of achieving a communication goal in parent-child interaction in which mothers had to speak or read aloud, can also be of interest when related to the same group (Bettes, 1988, Reissland et al., 2003). It turned out that mothers suffering from depression lose the ability to adjust their verbal behaviour (whole intonation patterns, pausing features and duration of utterances were studied) to the needs of a current situation: they make incongruously long pauses, and demonstrate ab-normality of conscious emotional expression in speech (they are either unable to express a particular emotion or express an unsuitable one despite having the right intention). These findings can be useful for understanding the effects of personality traits that are in some way similar to certain symptoms of depression, such as reduced activity and sluggishness, reduced vitality, a pessimistic approach to life (i.e. Distimity, as understood by Leonhard K. (2001), Manolova O. (2005)) on speech.
We suppose that intonation parameters of speech can be regarded as a set of individual and sociocultural means that help to achieve different communication goals. Presumably, this instrument is most essential to a person whose personality structure requires a large number of social contacts. Therefore, we have carried out research into the relationship between acoustic parameters of human speech and two aspects of personality: the specifics of the communication sphere as a part of temperament (Rusalov, 1997), and Demonstrativity (Manolova, 2005, Leonhard, 2001, Rusalov, 1997) as a personality trait.
In view of the issues mentioned above, the aims of this quasi-experimental research were 1) to establish how character and temperamental traits affect the intonation parameters of natural speech, 2) to find out which of the changes in subjects’ intonation patterns occur due to changes in communication context, 3) to examine weather these context changes moderate the influence of personal traits on speech.
Method
Participants. 30 people aged between 21 and 40, 15 women and 15 men, took part in this study. All sessions took place in a laboratory in presence of the experimenter.
Research procedure. The experimenter and participant were sitting at a table, facing each other. There was a personal computer in front of the experimenter. The participant was asked to take a microphone and give detailed answers to two questions, one for each trial. The question for the first trial was: “What do you think about the Unified State Exam (EGE in Russian)?”. The question for the second was: “What do you think about modern Russian TV?”.
During the participant’s answer in the first trial the experimenter was sitting in front of him, keepping eye contact and using other techniques of active listening (nodding, demonstrating through gestures that he understood what had been said, etc.) Thus, the experimenter played the part of the participant’s silent conversation partner. During the second trial the experimenter, having informed the participant in advance about his behavior, stood up, turned his back on the participant, and started looking through his papers. Thus, in the second trial the participant had no interlocutor, not even a silent one.
On finishing these two trials, the participant had to fill in two questionnaires: “Structure of Temperament Questionnaire” by Rusalov V. et al. (2007) and “A test of character traits” by Manolova O. et al. (2005).
Equipment. All the answers were registered in a MacBookPro7.1 computer using a Sennheiser e855 microphone and an ART Tube MP OPL single-channel microphone preamplifier.
Speech processing. In order to derive the acoustic parameters, we conducted a qualitative-quantitative acoustic analysis of each phonogram, 60 in total, i.e. two phonograms per participant. The duration of the registered phonograms varied from 1 to 5 minutes.
The qualitative part of the acoustic analysis included manual splitting of the phonogram into separate syllables using Sony Soundforge 10 software. This procedure helps us to obtain measurements of the fundamental frequency of all vowels pronounced by the participant, with the index on the time axis corresponding to each sound. Thus, we transformed the phonogram into rows of numerical pairs: “main tone frequency — corresponding time”, in which each pair ni is related to the syllable ni. Then we calculated the average consequential change of the fundamental frequency F0 by the formula:
∆F0 = , where F0i и F0(i-1) are two sequentially measured F0 .
We will call this Pitch Variability.
The range of variance of F0, normalized according to the pitch of the indivi- dual’s voice, was then calculated by the following formula:

This value is called Tone Span.
Three temporal indices of speech were calculated:
- Overall duration of speech — the total time of sounding, which reflects how long the participant was speaking to express his opinion on the given topic.
- Average duration of a syllable was calculated as the average time interval ∆t between two consecutive measurements of F0, i.e. between the vowels of two consecutive syllables.
- Speech Rate was calculated by the formula N/T, where N is the total number of syllables, corresponding to the number of F0 measurements, and T is the total duration of speech (ms).
Processing the psychodiagnostic data. The questionnaire of Rusalov V. was used for calculating the Index of Communication Activity of a personality and the Social Tempo, and the questionnaire of Manolova O. was used to measure Demonstra- tivity.
In order to carry out statistical analysis of the data in SPSS 14.0, we used one- and two-way analysis of variance (ANOVA), correlation analysis with the use of Pearson’s coefficient, and the non-parametric Mann-Whitney test.
Results
1. The first trial: face-to-face with a silent interlocutor.
A comparison of the differences between groups of participants with varying levels of Demonstrativity showed the effects of statistical significance, including its influence on vocal parameters: Pitch Variability (Uemp = 48, n1 = 17, n2 = 13, p = 0.009), Tone Span (F(1, 28) = 6.242; p = 0.019), and Speech Rate (F(1, 27) = 8.705; p = 0.006). Thus, the higher the degree of Demonstrativity, the narrower the Tone Span, and the lower the Speech Rate and Pitch Variability (fig. 1, 2, 3).
Table 1. A comparison of means: Speech Rate and Pitch Variability in the first trial, in groups with high and low Social Tempo.
| Social Tempo | N | Mean of Speech Rate | N | Mean of Pitch Variability |
| “quick” participants | 14 | 4.05 | 14 | 0.13 |
| “slow” participants | 15 | 3.18 | 16 | 0.17 |
Also, a between-groups comparison of participants with different levels of Social Tempo showed the statistically significant effect of this factor on Pitch Variability (F(1, 28) = 6.088; p = 0.02) and Speech Rate (F(1, 27) = 7.430; p = 0.011). The higher the Social Tempo, the lower the Pitch Variability and the higher the Speech Rate (table 1).
The results of the two-way ANOVA did not show any statistically significant interaction effect of Demonstrativity and Communication Activity on the following parameters: Pitch Variability (F(1, 26)=1.25, p=0.27, no main effect by the index of Communication Activity was found: F(1, 26) = 0.001. p = 0.98)); Tone Span (F(1, 26) = 0.019, p = 0.89, no main effect by the index of Communication Activity was found: F(1, 26) = 0.16. p = 0.69)) and Speech Rate (F(1, 25) = 1, p = 0.33, no main effect by the index of Communication Activity: F(1, 25) = 0.7, p = 0.78)) (Fig. 1, 2, 3).
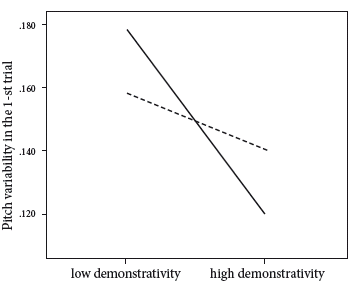
Figure 1. The interaction effect of Demonstrativity and Communication Activity on Pitch Variability in the first trial. A solid line denotes high Index of Communication Activity, and a dashed line denotes low Index of Communication Activity.
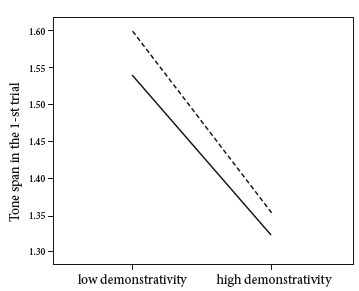
Figure 2. The interaction effect of Demonstrativity and Communication Activity on Tone Span in the first trial. A solid line denotes high Index of Communication Activity, and a dashed line denotes low Index of Communication Activity.
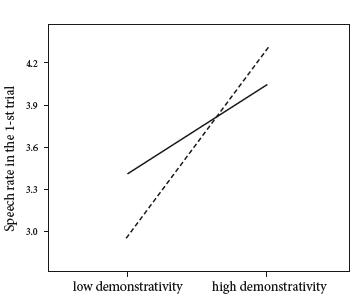
Figure 3. The interaction effect of Demonstrativity and Communication Activity on Speech Rate in the first trial. A solid line denotes high Index of Communication Activity, and a dashed line denotes low Index of Communication Activity.
2. The second trial: absence of an interlocutor.
A between-groups comparison of participants with varying levels of Demonstrativity did not show any statistically significant effect on Pitch Variability (F(1, 28) = 0.42, p=0.52), Tone Span (F(1, 28)=0.2, p=0.9), or Speech Rate (F(1, 27)=2.48, p = 0.13).
A between-groups comparison of participants with varying Social Tempo showed the effect of this factor on Pitch Variability on a quasi-significant level (F(1, 28) = 2.942; p = 0.097). The higher the Social Tempo, the lower the Pitch Variability (M1 = 0.16, M2 = 0.13, n1 = 16, n2 = 14, 1st group — “slow” participants, 2nd group — “quick” participants).
The two-way ANOVA showed an interaction effect between Demonstrativity and Communication Activity on a number of vocal parameters: Pitch Variability, (F(1, 26) = 3.345; p = 0.079, no major effects of Demonstrativity and Communication Activity were found (F(1, 26) = 0.003, p = 0.96; F(1, 26) = 0.491, p = 0.49)), Tone Span (F(1, 26) = 5.189; p = 0.031, no major effects of either of these factors were found (F(1, 26) = 0.145, p = 0.707; F(1, 26) = 0.018, p = 0.894)), Speech Rate (F(1, 25) = 4.418; p = 0.046; a major effect of Demonstrativity was found (F(1, 25) = 5.728, p = 0.025), no effect of Communication Activity was found (F(1, 25) = 1.510, p = 0.231).
When the Communication Activity indices have high values, Demonstrativity is higher and Pitch Variability and Tone Span are narrower; Speech Rate is not affected by Demonstrativity in this situation. When the indices of Communication Activity have low values, Demonstrativity is higher, Pitch Variability is greater, Tone Span is wider, and Speech Rate is higher (Fig. 4, 5, 6).
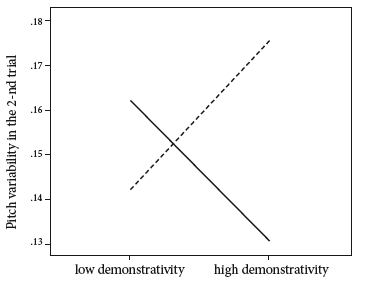
Figure 4. The interaction effect of Demonstrativity and Communication Activity on Pitch Variability in the second trial. A solid line denotes high Index of Communication Activity, and a dashed line denotes low Index of Communication Activity.
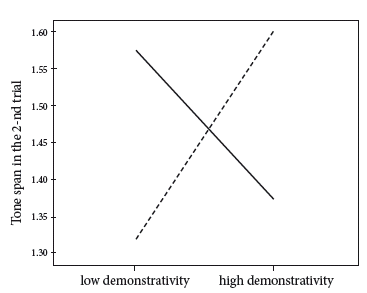
Figure 5. The interaction effect of Demonstrativity and Communication Activity on Tone Span in the second trial. A solid line denotes high Index of Communication Activity, and a dashed line denotes low Index of Communication Activity.
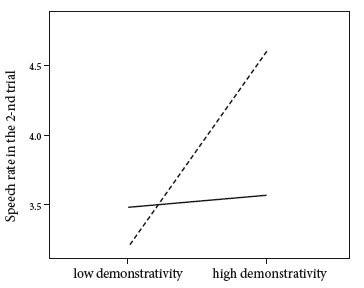
Figure 6. The interaction effect of Demonstrativity and Communication Activity on Speech Rate in the second trial. A solid line denotes high Index of Communication Activity, and a dashed line denotes low Index of Communication Activity.
3. The correlations between vocal speech parameters in the first trial.
The results of correlation analysis between vocal parameters showed a number of statistically significant correlations: Pitch Variability has a negative correlation with Speech Rate (r = 0.629, p=0.01) and a positive correlation with Tone Span (r=0.672, p<0.01) and Average duration of a syllable (r=0.727, p<0.01); Tone Span has a positive correlation with Duration of speech (r=0.567, p<0.01) and a negative correlation with Speech Rate (r = –0.542, p < 0.001).
4. The correlations between vocal parameters in the second trial.
The use of the correlation analysis procedure for finding correlations between the vocal parameters in the second trial made it possible to trace one statistically sig- nificant positive correlation — between Pitch Variability and Tone Span (r = 0.512, p < 0.01), and a negative one — between Average duration of syllable and Speech Rate (r = –0.929, p < 0.01).
Discussion 1. Correlations between vocal parameters in the first and second trials.
The parameters that describe the tonal characteristics of speech (Pitch Variability and Tone Span) are closely connected in both trials: the more changeable the voice pitch, the wider the Tone Span becomes. This result can be explained by the fact that both parameters describe the characteristics of pitch variance of the whole speech sample, and their calculation is based on the measurements of ΔF0 and F0.
The connection between Average Duration of Syllable and Speech Rate was also expected, because both of these parameters represent speech tempo — the longer the Average Duration of Syllable, the lower the Speech Rate.
It is interesting to note the negative correlation between Pitch Variability and Speech Rate in the first trial — the more changeable the pitch of voice (i.e. the more modulations that can be traced in the speaker’s voice), the lower the Speech Rate will be, and vice versa. It is noteworthy that in the second trial there was no similar correlation. In the context of “intonation means” this fact can be explained as follows: if a man can see his conversation partner and notice his partner’s reactions of active listening and interest, he will select such methods as either variance of tone, i.e. intonation, or speech tempo (he can probably focus on the volume of verbal output or its content).
The striving to say a lot within a given time (even though it was not limited on purpose) might indicate a detailed and reasoned viewpoint on a given topic, but also the absence of any viewpoint accompanied by a wish to make an impression of a person with his own views and capable of reasoning.
The absence of a correlation between the parameters of intonation and tempo in the second trial can be interpreted as a greater variety in the use of vocal means during the creation of oral speech in the absence of a conversation partner — an individual might “add“ to his vocal methods, as well as exclude a greater variance of tone, simultaneously changing the parameters of speech tempo. One of the reasons for this might be that the speaker cannot be sure of the impression he is making on the listener (because the latter is still present in the room, and after all gets the phonogram when the experiment is over), so if the speaker is trying to make an impression, he will presumably use all available vocal means in the non-feedback situation during his monologue. Another reason, might on the contrary be a lack of interest in making an impression on the listener who has distanced himself.
2. Demonstrativity and Communication Activity.
In the first trial, which takes place in the presence of an interlocutor, Demonstrativity affects three interconnected vocal parameters. However, in the first trial the Index of Communication Activity has no influence of its own on the vocal parameters. Only one of the constituents, Social Tempo, affects two out of three interconnected vocal parameters (Pitch Variability and Speech Rate), while the other two (Social Plasticity and Social Ergonicity) have no effect on the vocal parameters in the first trial. These results partially match the previous findings (Belovol, 1999): the researcher found that Social Tempo has a negative correlation with the so-called “voicing coefficient”, measured as a percentage of the time of pronouncing vowel sounds within the overall speaking time (i.e. the quicker the speech, the shorter the time spent pronouncing the vowels).
As for Demonstrativity, we follow Leonhard K. (2001), Lichko A. (2010) and Manolova O. (2005) here, and consider it as a special skill to achieve one’s goals through communication with others by means of social competence and role-play, the ability to adjust one’s behaviour to the conversation partner. Therefore, the more an individual tends to regard his social links, communication, and ability to interact with people as a means of achieving his goals, the less changeable is his tone (Pitch Variability), the narrower his Tone Span, and the higher his Speech Rate. The key feature of these people appears to be high Speech Rate. A person with a high index on the scale of Demonstrativity, regardless of having an opinion on the given topic or not, will try to say as much as possible in order to show his interlocutor that he has got something to say.
In the second trial, neither Demonstrativity nor Communication Activity as separate variables had any statistically significant effect on the vocal parameters. However, they did have an interaction effect on the group of vocal parameters (Pitch Variability, Tone Span and Speech Rate) influenced by Demonstrativity during the first trial. This interaction effect can be interpreted as the necessity of a special condition that triggers the effect of Demonstrativity in a situation where the speaker has no attentive conversation partner. It depends on whether an area of communication is predominant for the speaker, and whether he is confident in communication or not. If the individual has a low Index of Communication Activity, then the higher his index of Demonstrativity, the greater the Pitch Variability, the wider Tone Span, and the higher the Speech Rate. Thus, having any weaknesses in the communication area, an individual with higher Demonstrativity will use all his vocal means to impress his potential listener: voice modulations, a wide tone span, and high speech tempo. So to speak, he will be doing his best to “play to the gallery”.
At the same time, people who are strong at communication (i.e. have a high Index of Communication Activity, which in our study means having high scores on each of the following parameters: Social Plasticity, Social Tempo, and Social Ergonicity) have a different effect of Demonstrativity: the higher the Demonstrativity, the lower the Pitch Variability, and the narrower the Tone Span, while there is no difference in the Speech Rate. It is noteworthy that the last aspect of the interaction effect of Demonstrativity and dependent variables is similar to its main effect in the first trial.
When interpreting the data in terms of intonation means, we should note that, on condition of a high Index of Communication Activity, an individual with high Demonstrativity will not use the opportunity to enrich his intonation and increase his Speech Rate. Perhaps, the effect of the listener’s presence is not so vivid here as in the first trial, and therefore there is no orientation on the listener, which is typical for those who have Demonstrativity.
It is therefore clear that the effect of Demonstrativity on speech characteristics is the opposite for people with different levels of Communication Activity. Supposedly, people with lower levels of Communication Activity are using a compensatory mechanism in their behavior, and therefore pay more attention to situational social interactions, trying to impress their partner every time, while people with higher levels of Communication Activity and Demonstrativity focus on the quantity, not quality of social interaction, and therefore the absence of an interlocutor could lead to a great decrease of interest in self-demonstration.
It is worth noting that the last combination of characteristics — the low index of Communication Activity and the high index of Demonstrativity — is quite rare, according to Manolova O. (2005), because Demonstrativity usually has a positive correlation with Communication Activity. However, a case is possible in which one aspect of the communication sphere, or all of its aspects simultaneously, are not very strong (e.g. because of physiological problems), which enables us to exclude this individual from the group of people confident in communication. However, we can still regard this individual as a personality with a strong level of Demonstrativ- ity (Leonhard, 2001).
Conclusion
In conclusion we can summarize that changes in the context of speech communication seem to fundamentally affect correlations between intonation parameters: there were more correlations and of a larger variety in the presence of an interlocutor. In our opinion this may indicate a reorganization of the ways people use intonation while speaking. We suppose that communicative context is the condition of Demonstrativity to appear as a factor that determines intonation performance style. Conversely, a non-communication context induces more complex determination, i.e. an aggregate effect of Demonstrativity and Social Activity.
A practical application of the results of the present research can be linked with the development of psychodiagnostic means that would make it possible to assess individual features of a speaking person based on measurement of speech features. It also may prove very useful for psychodiagnostics to choose an appropriate condition that would provoke the very appearance of the personality traits’ influence on speech. In view of the above, we consider the development of special speech tasks, as well as determining conditions and contexts that would trigger the demonstration of different types of intonation, to be a subject for further research. Moreover, the obtained results may be useful for the development of software able to simulate the speech patterns of a person with certain personality traits.
To develop this subject, the authors would like a) to clarify in a controlled experiment weather a test subject can perceive the situation of talking in the absence of an interlocutor as a communication act depending on his character and temperamental traits; b) to conduct an experiment with a wider variation of сommunication aspects of experimental speech tasks and c) a wider variation of other conditions of performance of experimental speech tasks that may trigger the effect on intonation of character traits that have not shown any influence on intonation in the present research, and that appeared not to correlate with the social aspects of temperament.
References
Aronovitch C. (1976). The voice of personality: stereotyped judgments and their relation to voice quality and sex of speaker. Journal of Social Psychology, 8, 207–220. doi: 10.1080/ 00224545.1976.9924774
Belovol E. V. (1999). Proyavlenie svoystv temperamenta v akusticheskikh parametrah rechi [The appearance of temperamental traits in acoustic features of speech. Ph. D. Thesis]. Moscow State University of Civil Engineering (MGSU), Moscow.
Bernshteyn S. I. (1996). Slovar’ foneticheskikh terminov [The Thesaurus of phonetic terms]. Moscow.
Bettes B. (1988). Maternal depression and motherese: temporal and intonational features. Child Development, 59, 1089–1096. doi: 10.2307/1130275
Blinova E. A. (2001). Universal’noe i spetsificheskoe v intonatsionnom oformlenii neytral’nykh i emotsional’no okrashennykh vyskazyvaniy na nerodnom yazyke [Universal and specific aspects of prosodic appearance of neutral and emotionally colored utterances in non-native languages. Ph. D. Thesis]. Saint-Petersburg State University. St.-Petersburg.
Cheremisina N. V. (1982). Russkaya intonatsiya: poeziya, proza, razgovornaya rech’ [Russian prosody: poetry, prose, informal speech]. Moscow.
Feldstein S., Sloan B. (1984). Actual and stereotyped speech tempos of extraverts and introverts. Journal of Personality, 6, 188–204. doi: 10.1111/j.1467-6494.1984.tb00352.x
Frick R. W. (1985) Communicating emotion: The role of prosodic features. Psychological Bul- letin, Volume. 97, 3, 412–429. doi: 10.1037/0033-2909.97.3.412
Gawda B. (2007). Neuroticism, Extraversion, and Paralinguistic Expression. Psychological Re- ports, 6, 100(3), 721–726.
Grigor’eva E. M. (1999) Intonatsionnoe virazhenie otritsatel’nykh emotsiy v russkom nemestoimennom voprose [Prosodic expression of negative emotions in questionary utterance in Russian. Ph. D. Thesis]. People’s Friendship University of Russia. Moscow.
Kazannikova D. P. (2003). Nekotorye osobennosti realizatsii kategorii «konstrantnost’-variativnost’» v spontannykh monologakh (v ramkakh organizuyushchey funktsii intonatsii) [Some peculiarities of variability realization in spontaneous monologue as a structuring function of prosody. Ph. D. Thesis]. Moscow State Pedagogical University. Moscow.
Keller B. (2005). Speech prosody, voice quality and personality. Logopedics Phoniatrics Vocology, 5, 72–78. doi: 10.1080/14015430500256543
Kodzasov S. V. (1999). Urovni, edinitsi I protsessy v intonatsii [Levels, units and processes in prosody]. Problemy fonetiki [Problems of Phonetics], 3, 197–215. Moscow.
Kushnir N. Ya. (1990). Stadial’no-vozrastnaya dinamika intonatsionnoy strukturi placha rebenka v pervye mesyatsi zhizni [Developmental dynamics of prosodic structure or newborns cry. Ph. D. Thesis]. Moscow State Pedagogical University. Moscow.
Leonhard K. (2001). Aktsentuirovannye lichnosti [Accentuated personality]. Moscow.
Lichko A. E. (2013). Psikhopatii I aktsentuatsii kharaktera u podrostkov [Psychopathy and accentuation of personality traits in adolescents]. St.-Petersburg: Rech’.
Makarova V. (2007). The Effect of Pitch Peak Alignment on Sentence Type Identification in Russian. Language and speech, Volume 50, 3, 385–422. doi: 10.1177/00238309070500030401
Manerov V. H. (1997). Psikhodiagnostika lichnosti po golosu i rechi [Personality psychodiagnostics based on voice and speech]. St.-Petersburg.
Manolova O. N. (2005). Temperamental’naya osnovf kharaktera [Temperamental basis of the character. Ph. D. Thesis], Moscow State University of Civil Engeneering (MGSU), Moscow.
Ramsay R. W. (1968). Speech patterns and personality. Language & Speech, 1-3, 11(1), 54–63.
Reissland N., Shepherd J. & Herrera E. (2003). The pitch of maternal voice: a comparison of mothers suffering from depressed mood and non-depressed mothers reading books to their infants. Journal Of Child Psychology & Psychiatry & Allied Disciplines, 2, 255–261. doi: 10.1111/1469-7610.00118
Rusalov V. M. (1997). Oprosnik formal’no-dinamicheskoy struktury individual’nosti [Structure of Temperament Questionnaire]. Moscow.
Rusalov V. N., Trofimova, I. N. (2007). The Structure of Temperament and Its Measurement. Toronto: Psychological Services Press. Steer A. B. (1974). Sex differences, extraversion and neuroticism in relation to speech rate during the expression of emotion. Language & Speech, 10–12, 17(4), 80–86.
Svetozarova N. D. (1982). Intonatsionnaya sistema russkogo yazyka [Prosody structure of the Russian language]. Leningrad.
Tolkmitt F. J., Scherer K. R. (1986). Effect of experimentally induced stress on vocal parameters. Journal of Experimental Psychology: Human Perception & Performance, 8, 302–313. doi: 10.1037/0096-1523.12.3.302
Tseplitis L. K. (1974). Analiz rechevoy intonatsii [Analysis of Speech Prosody]. Riga.
Vitt N. (1991). Lichnostno-situatsionnaya oposredovannost' vyrazheniya i raspoznavaniya emotsiy v rechi [Mediation of emotion expression and recognition in speech by personality and situational factors]. Voprosy psikhologii [The Questions of Psychology], 2, 95–107.
To cite this article: Anna S. Silnitskaya, Alexey N. Gusev (2013). Character and temperamental determinants of prosodic parameters of natural speech. Psychology in Russia: State of the Art, 6(3), 95-106
The journal content is licensed with CC BY-NC “Attribution-NonCommercial” Creative Commons license.


