Large-scale network analysis of imagination reveals extended but limited top-down components in human visual cognition
Abstract
We investigated whole-brain functional magnetic resonance imaging (fMRI) activation in a group of 21 healthy adult subjects during perception, imagination and remembering of two dynamic visual scenarios. Activation of the posterior parts of the cortex prevailed when watching videos. The cognitive tasks of imagination and remembering were accompanied by a predominant activity in the anterior parts of the cortex. An independent component analysis identified seven large-scale cortical networks with relatively invariant spatial distributions across all experimental conditions. The time course of their activation over experimental sessions was task-dependent. These detected networks can be interpreted as a recombination of resting state networks. Both central and peripheral networks were identified within the primary visual cortex. The central network around the caudal pole of BA17 and centers of other visual areas was activated only by direct visual stimulation, while the peripheral network responded to the presentation of visual information as well as to the cognitive tasks of imagination and remembering. The latter result explains the particular susceptibility of peripheral and twilight vision to cognitive top-down influences that often result in false-alarm detections.
Received: 05.10.2014
Accepted: 30.10.2014
Themes: Psychophysiology; Cognitive psychology
PDF: http://psychologyinrussia.com/volumes/pdf/2014_4/2014_4_4-19.pdf
Pages: 4-19
DOI: 10.11621/pir.2014.0401
Keywords: perception, imagination, remembering, fMRI, large-scale cortical networks, resting states, mirror neuron system, real-world visual stimuli
Introduction
“In the night, imagining some fear, how easy is a bush supposed a bear”
W. Shakespeare: A Midsummer Nights Dream (Act 5, Scene 1)
Current fMRI studies usually aim to identify brain structures in which the bloodoxygen-level dependent (BOLD) response covaries with the subjects performance in a specific cognitive task. However, this outcome cannot often be satisfactorily achieved because of the sparsity of network interrelations on a small scale (Smith, Vidaurre, Beckmann, Glasser, Jenkinson, Miller, Nichols, Robinson, Salimi-Khorshidi, Woolrich, Barch, Ugurbil, & Van Essen, 2013). A better solution can then be found by studying the whole brain and large-scale network activity. This macroscopic approach has already resulted in some important discoveries, including the identification of resting state networks (RSNs) (Barkhof, Haller, & Rombouts, 2014; Jann, Kottlow, Dierks, Boesch, & Koenig, 2010). RSN activity maybe the basis of higher-order thoughts and personal worries, processes that were long considered too elusive to be investigated under laboratory conditions. Another important development was the discovery of the mirror neuron system (MNS), an extended cortical network that has been implicated in the mediation of imitation learning, language acquisition, internal dialogue and even self-consciousness (Rizzolatti, 2005).
In this study, we apply this macroscopic strategy to the long-standing problem of the interaction between perception and imagination. This issue has been the subject of intensive discussions since the early days of experimental psychology. For example, such classics as Titchener and Kuelpe held opposite opinions on the role of visual imagery in the detection of near threshold visual objects (see Velichkovsky, 2006). Even 100 years later, the application of electrophysiological methods did not solve the problem due to their low spatial resolution. However, it has been repeatedly shown on the basis of psychophysical, electrophysiological and neuroimaging data that some early stages of visual processing could be influenced by top-down cognitive processes (Van der Stigchel, Belopolsky, Peters, Wijnen, Meeter, & Theeuwes, 2009; Cichy, Heinzle, & Haynes, 2012). We aimed to investigate the exact nature of these “early stages” and their underlying neural mechanisms.
Method
Participants and experimental design
Twenty-one healthy volunteers (13 males; mean age 23 years; age range: 20-38 years, students and teachers of Moscow universities) participated in the study. All participants were right-handed and had no history of neurological or psychiatric disorders. The study was approved by the local Ethical Committee of the Institute of Higher Nervous Activity and Neurophysiology of the Russian Academy of Sciences. For the material we used familiar (“lecture”) and non-familiar (“parachute jump”) video clips. A block design consisted of 6 blocks: 3 baseline blocks alternating with3 experimental blocks. The duration of each block was 30 sec allowing for 10 fMRI scans (one scan every 3 sec). Nine different tasks as combinations of baseline and experimental blocks were investigated in the same temporal order for all subjects: 1) fixation cross + jump imagination, 2) fixation cross + lecture imagination, 3) fixation cross + jump viewing, 4) fixation cross + lecture viewing, 5) lecture viewing + jump viewing, 6) jump viewing + jump imagination, 7) lecture viewing + lecture imagination, 8) fixation cross + jump imagination/remembering, and 9) fixation cross + lecture imagination/remembering. The duration of the whole series of tasks usually did not exceed 45 minutes.
Data acquisition and analysis
Time series of 60 repeated whole brain fMRI images were acquired using T2*-weighted GRE-EPI sequence (TR= 3000 ms, ТЕ = 35 ms, FOV=24x24 cm2,30 slices with thickness of 4 mm, gap= 1 mm, pixel size= 1.8 x 1.8 mm2) in 3.0T Achieva Philips MRI scanner. Anatomical data (T1 MP RAGE sequence with TR=8.6, ТЕ = 3.8, voxel size = 1 mm3) were acquired to match structures and functional areas.
The fMRI data for each subject were preprocessed using the SPM 8 software package (http://www.fil.ion.ucl.ac.uk/spm). The functional scans were spatially realigned and normalized to the standard MNI-template with preservation of their spatial resolution (FWHM = 5 mm). If the head motion and rotation parameters of a subject exceeded ± 1 mm and ±1°, respectively, the data were excluded from further analysis. The main part of the analysis was performed using three software packages: SPM 8, GIFT (http://mialab.mrn.org/software/gift) and Caret (http:// brainvis.wustl.edu). Group statistical parametric maps (SPMs) were constructed using “stimulation — baseline” contrast with t-test (puncor <0.01, t>2.5) for every task. Then, multiple comparisons were corrected (pFWE = 0.05). Structural templates were formed using WFU PickAtlas (Tzourio-Mazoyer, Landeau, Papathanassiou, Crivello, Etard, & Delcroix, 2002). The latter quantitative statistical analysis was performed with the sums of activated voxels within the whole brain, anterior/posterior areas and the groups of structures under every experimental task condition.
For the independent component analysis (ICA GIFT), data from all participants were reduced using two stages of principal component analysis (Calhoun, Adali, Pearlson, & Pekar, 2001). The optimal number of independent components (ICs) was determined by the minimum description length (MDL) criterion (Li, Adali, & Calhoun, 2007). Decomposition was performed using the Infomax algorithm (Bell, & Sejnowski, 1995). Statistics of t-values were used (t>3.9, p<0.001) to display the voxels that contributed most strongly to a particular IC through all participants. Primary IC selection was provided according presence of 85% of grey matter inside the IC (Botzung, LaBar, Kragel, Miles, & Rubin, 2010). The next step was visual assessment of ICs spatial distribution and their matching to the RSN clusters (Jann et al, 2010). Hereafter, we will call the obtained ICs large-scale networks. The quantitative description of the networks was concluded in time series correlation of the network and model BOLDsignal used in SPM 8 contrast processing (r > 0.32, p < 0.01, df = 58).The results of statistical parameterization (SPM 8) and ICA (GIFT) were mapped to the Caret model brain surface with Brodmann areas (BA) borders (Van Essen, 2012).
Results
Statistical parametric mapping of activation
Figure 1 presents data on SPMs in the cortex of flattened left and right hemispheres (t-value distribution, -2.1 <t<2.1, puncor=0.01, df=20) for nine consecutive tasks of our experiment. As seen, imagination of “jump” and “lecture” without previously viewing these scenarios diffusely activates a large number of areas in the anterior and posterior parts of both hemispheres including the periphery of the visual cortex BA 17,18,19. The central parts of these visual areas are strongly suppressed. In contrast, direct perception of the “jump” and “lecture” video clips activates the central parts of striate (17, 18) and extrastriate BAs (7, 19, 37) in addition to their periphery. A clear involvement of MNS BA 44 and 45 is apparent in the right hemisphere, and the “jump” video clip produces a particularly extensive activation in these areas. Its specificity consists of a stronger bilateral activation of the visual motion BA 19, intermodal BA7, somatosensory BA 2,5 and premotor BA 6 in both hemispheres. The activation of the MNS areas also seems to be enhanced.
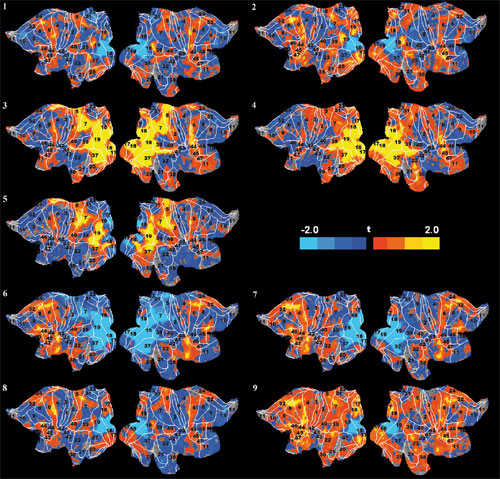
Figure 1. Averaged SPMs of all subjects for the following task conditions: (1) “jump” imagination, (2) “lecture” imagination, (3) viewing of “jump” (4) viewing of “lecture”, (5) viewing of “jump” after “lecture”, (6) imagination/remembering of “jump” after viewing “jump”, (7) imagination/remembering of “lecture” after viewing “lecture”, (8) imagination/remembering of “jump”, and (9) imagination/remembering of “lecture”. The white lines are BA borders with the standard BA numbers (see text for further details).
The imagination/remembering of the “jump” and “lecture” scenarios after viewing these video clips (Figure 1, tasks 6 and 7) led to an extensive pattern of activation in the anterior cortex, which was more pronounced in the left hemisphere. A very clear activation of the verbal task-setting mechanisms was evident around the classical Broca’s zone (BAs 44,45,46,47) and BA 32, which is known for its role in cognitive control (Petersen, & Posner, 2012). At the same time, one can observe a broad inhibition in the visual cortex, within BAs 7,17,18,19, 37, 39. During these cognitive tasks, there are again signs of activation on the remote periphery of the visual areas BA 17 and 18. The condition of delayed imagination/remembering of the “jump” and “lecture” scenarios after fixating in a cross (Figure 1, tasks 8 and 9) revealed a similar pattern of activity, albeit with a weaker inhibition of the central parts of visual cortex. This activation extends toward anterior BAs 6, 8, 24, 32,44, 45,46, and 47 and posterior BAs 5, 7, 39, and 40, including the periphery of visual BAs 17, 18, 19, and 37. Again, these tasks predominantly activate the left hemisphere including BAs 44,45,46,47 and BA 32.
Statistical assessment of the number of activated and deactivated voxels
The visual assessment of the SPM differences in activation is only qualitative. The quantitative analysis of every BA is impossible due to an insufficient number of voxels. Here, we merely show a general way to prove statistics of differences in activation, omitting the details. To this aim, one can analyze a vast activation volume of the whole cortex, that of anterior and posterior areas, as well as separated large-scale functional units. In our experiment, the amount of volume elements (voxels) in the whole brain is =110000, where the number of grey matter voxels is Ngrey = 71000. The error is AN = Nan * 0.01 = 1100, taking into account the absence of a multiple comparison correction (puncor<0.01). An illustration of this approach is the comparison of the overall activation within anterior and posterior parts of the cortex. The border of such a division can be set along the central sulcus. Next, we analyzed the amount of activation of anterior (N, = 29400) and posterior (N2 = 42000) cortical grey matter (Figure 2). The absolute error as previously is AN = 1100, whereas the relative error is AN/Nl = 3.4 % for anterior areas and AN/N2 = 2.4 % for posterior areas. The statistical analysis was provided with the use of a t-test for uncorrelated samples.
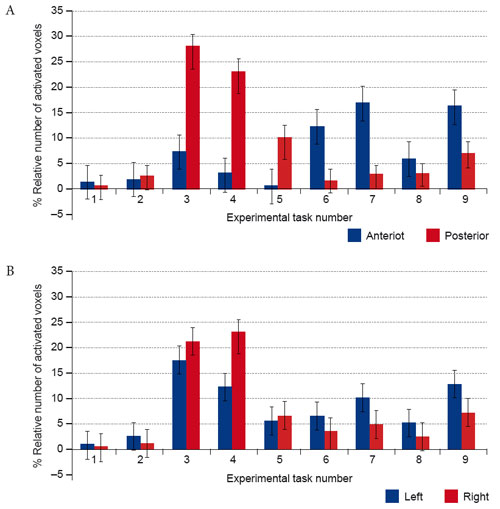
Figure 2. Comparison of the averaged activation volumes through the whole cortex: (A) Anterior versus posterior cortex areas; (B) Left versus right hemispheres. The activation volume is in relative units: number of activated voxels of the area/overall number of voxels in the area.
The first two task conditions do not show any significant difference between the activation of the anterior and posterior areas. In the viewing conditions, there is a strong dominance of the posterior activation for both video clips (p< 0.001). A comparison of viewing “jump” versus” lecture” revealed an additional posterior prevalence in perception of this dynamic scenario (p < 0.001). In contrast, an anterior dominance is observed for the cognitive tasks of imagination/remembering following viewing (p< 0.001) and for the delayed imagination/remembering, although a strong effect (p< 0.001) was obtained only for “lecture”. An analysis of this type is possible with respect to the relative lateralization of activation because an obvious anatomical division line also exists for this categorization. The relative error is 2.9% for both the left and the right hemispheres. Although there are no significant differences in separate task conditions, there is a clear trend toward more right-sided activation in bottom-up viewing tasks and a relative prevalence of left hemisphere involvement in the top-down tasks of imagination and remembering. A significant overall interaction between laterality and anterior-posterior dimension of activation (p < 0.05) confirms this impression.
In other cases, the functional units of brain activity should first be extracted on the basis of empirical data, which may be aided by conducting an independent component analysis.
Independent component analysis
Seven large-scale networks were identified by the ICA after applying the Minimum Description Length criterion (Balan, 2007). Taken together, they explain nearly 80% of the overall data variance. A comparison shows that all but two of these networks can be represented as combinations of known RSNs (Jann et al., 2010). The identified networks do not differ in their internal structure across conditions but show a unique degree of involvement in every task. Figure 3 presents mappings of these networks (t-value distribution, -3.9 < t < 3.9, puncor = 0-001, df= 20) on the flattened left and right hemispheres together with the data for the correlation between the time course (60 scans with one scan every 3 sec) of their voxel activation and a conventional model design function (hemodynamic response function, HRF) for nine tasks of the experiment: imagination parachute (IMP), imagination lecture (IML), presentation parachute (PRP), presentation lecture (PRL), presentation parachute after lecture (PLP), presentation then imagination parachute (PIP), presentation then imagination lecture (PIL), remembering parachute (REP), and remembering lecture (REL).
The first such network we consider is the task central visual network (tCVN) situated in the caudal pole and lateral surface of the occipital lobe. The tCVN closely coincides with the three known RSNs: the occipital visual (OVN),visual ventral (VYN) and, to a lesser degree, visual dorsal (VDN) networks. In principle, the task peripheral visual network (tPVN) combines these same RSNs. One crucial difference between these networks is reflected in their names and consists of the contrasting involvement of the central and peripheral parts of the retinotopically organized BAs 17, 18, 19, 37, and 39. This structural difference is paralleled by a strong functional dissociation; the activation of both networks correlates positively with visual stimulation but is opposite in the cognitive tasks, whereby the periphery of the visual cortical areas is the locus of the top-down activation. The activation is particularly systematic in the case of the “lecture” scenario, which is familiar to all subjects. At the same time, there are signs of a decrease in metabolism in the loci of the tCVN.
The next two task networks are the lateralized fronto-parietal networks, tFPNl and tFPNR. These networks also overlap with three known RSNs: the working-memory (WMN), control fronto-parietal (FPCN), and the visual RSN of the dorsal pathway(DVN), which some research has implicated as mediating topdown influences on the visual cortex (Corbetta, Patel, & Shulman, 2008). The networks also include BAs 44 and 45, as well as 39 and 40,which are involved in verbal processing and task setting (Stuss, 2011) and are regions where mirror neurons are repeatedly detected (Rizzolatti, 2005). Both of these networks are only loosely connected, functioning separately in each hemisphere. The activation of the task-related left fronto-parietal network correlates with the model design HRF for the imagination of the “jump” scenario. The imagination of the familiar “lecture” scenario and “jump”, after the latter became more familiar, tempers and even reduces this network activity. The viewing of the video clips does not require activation. The task-related right fronto-parietal network is identified in only seven out of nine experimental conditions. Moreover, the metabolic behavior of tFPNR is somewhat indistinct and seems to consist of an inhibitory reduction of activity when processing the more familiar “lecture” scenario in any of both modes, top-down and bottom-up.
Figure 3. Averaged mapping of large-scale task networks, including the correlation between their voxel activity and a model design function over measurement time in all task conditions; blue and red curves show the time course of the model design function (HRF) and task network metabolism, respectively; r — Pearson correlation:
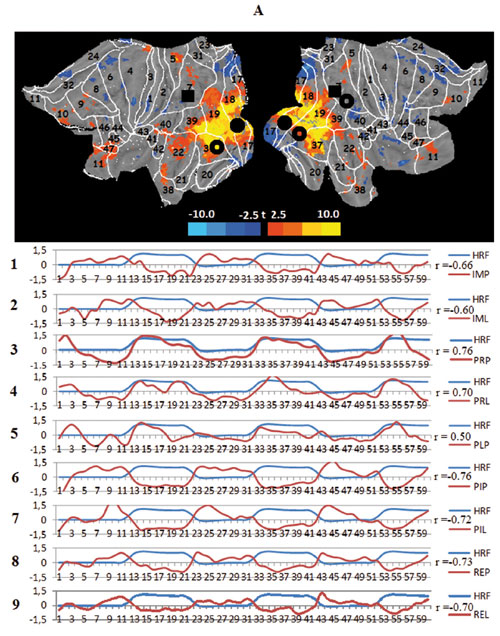
A. The task central visual network (tCVN), black circles — spatial centers of the occipital visual network (OVN), transparent circles — centers of the ventral visual network (VVN), black squares — center of the dorsal visual network (DVN);
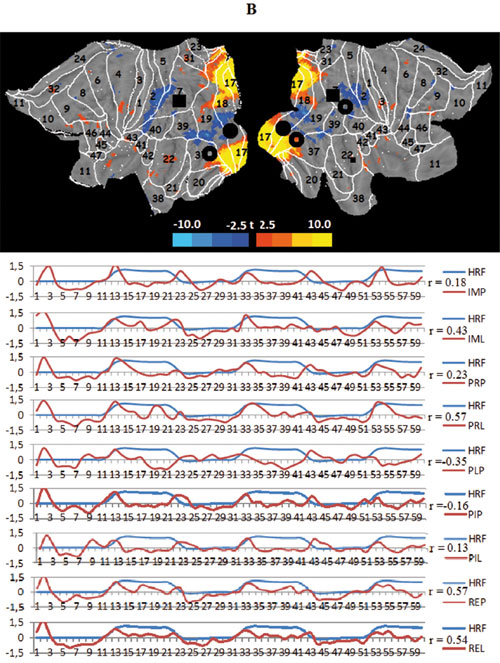
B. The task peripheral visual network (tPVN);
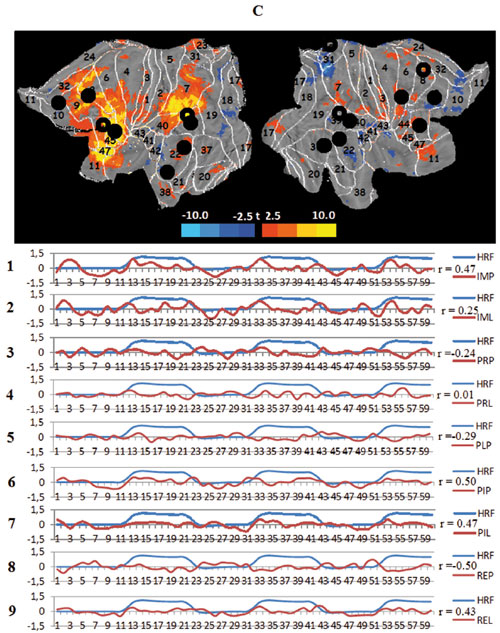
C. The task left fronto-parietal networks (tFPNL), black circles — spatial centers of the left working memory network (WMNL), transparent circles — centers of the fronto-parietal control network (FPCN), black squares — center of the dorsal visual network (DVN);
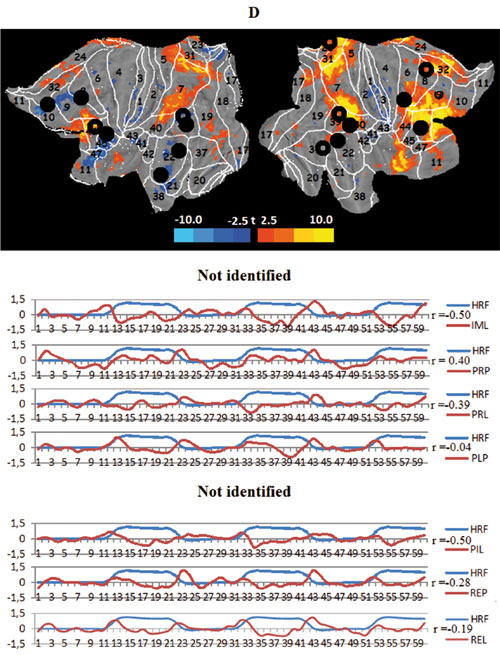
D. The right task fronto-parietal networks (tFPNR), black circles — spatial centers of the right working memory network (WMNR);
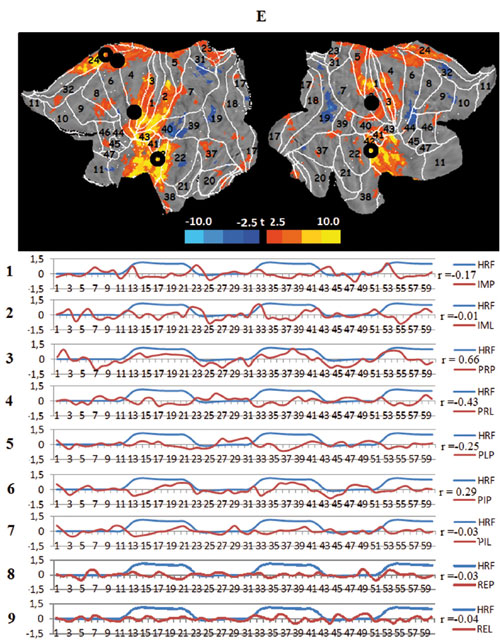
E. The task central temporal networks (tCTN), black circles — spatial centers of the somato-motor network (SMN), transparent circles — centers of the auditory cortex network (ACN);
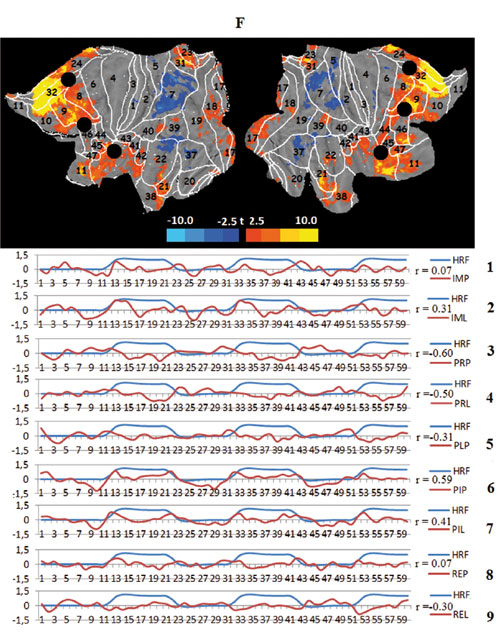
F. The task prefrontal network (tPFN), black circles — spatial centers of the frontal attention network (FAN);
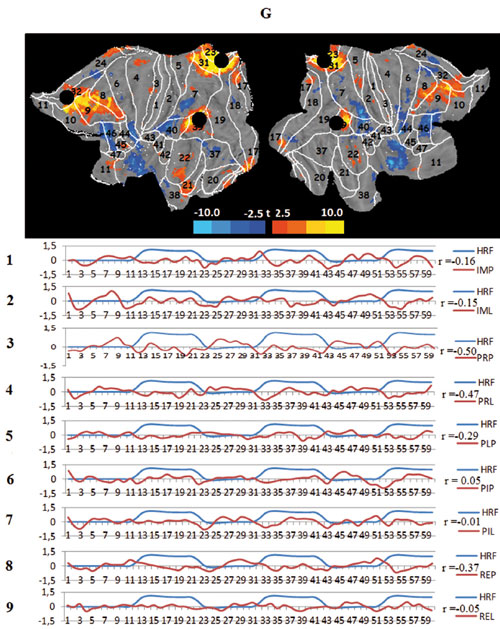
G. Task default mode network (tDMN), black circles — spatial centers of the default mode network (DMN).
The task central temporal network (tCTN) is situated in the central sulcus region and the temporal lobe (Figure 8). It consists of the somato-motor RSN (SMN) and the auditory cortex RSN (ACN). These structures can be considered as components of the somatosensory, motor and auditory systems. The network activity is manifested during both viewing tasks; the “jump” viewing causes a high correlation with the model HRF, while the “lecture” scenario, which is familiar and contains less dynamic elements, anticorrelates with the model. Other task conditions have no relation to the activity of this network.
The last two networks identified by the ICA are the task prefrontal network (tPFN) and the task default mode network (tDMN). The task prefrontal network coincides spatially with the frontal attention RSN (FAN), including regions known to participate in task setting, working memory and executive control (i.e., prefrontal BAs 8, 9,44, 45, and 46 and the adjacent parts of the anterior cingulate BAs 24 and 32).The mode of activity of the tPFN is in a sense opposite to visual sensory processing; the network is inhibited in viewing conditions. However, it is strongly activated when imagination immediately follows movie playback, effectively prolonging the visual effects and transforming them in mental images. The content of the video scenarios has no effect on the activation of this network. Finally, the task default mode network can be identified. This network appears to be identical to the classical resting state default mode network (DMN), consisting of BAs 8,9, and 10 in the prefrontal and BAs 31 and 39 in the parietal cortex. This network behaves as a default structure, remaining silent or reducing metabolism dining all types of imposed task activities, both external such as viewing films and internal such as imagination, especially if the latter involves the processing of the unusual and emotionally saturated “jump” scenario.
Discussion
Visual imagery refers to the ability to — more or less vividly — represent objects and their spatial layout in the absence of retinal stimulation, i.e., in a top-down manner. The problem of the similarities and differences between perception and imagery is one of the oldest and still unsolved problems of psychology and neuroscience. The fields of psychophysics, electrophysiology and cognitive neuroscience have attempted to solve the problem by their respective methods but achieved only moderate success. The recent application of MRI-based methods has revealed a significant overlap between both groups of processes (Cichy et al., 2012) and has connected the capacity of imagination to an extended activation of the visual cortex including BA 17 (Klein, Dubois, Mangin, Kherif, Flandin, Poline, Denis, Kosslyn, &Le Bihan, 2004). These results may imply a kind of neurophysiological identity of both processes. However, this conclusion requires further specification because it contradicts obvious differences in the functional and phenomenological properties of perception and imagery.
In our study, we applied a new methodology based on the extraction of largescale functional networks towards uncovering a solution to this long standing problem. By using series of imagination, remembering and perception tasks with dynamic real-life content and a changing combination of baseline and experimental conditions, we demonstrated that patterns of BOLD-responses in these tasks can indeed be reduced to the metabolism of a limited number of large-scale neural networks. Specifically, we identified seven such networks, which all closely resemble some of the macroscopic units independently found in the analysis of brains RSNs (Jann et al., 2010; Smith et al., 2013). This fact can be considered as a general validation of our approach.
Moreover, the task-related large-scale networks elucidated in the present investigation demonstrate behavior that, at least in part, supports the main results from other recent studies of visual imagination, such as the substantial overlap of the activation patterns in imagination, remembering and perception, as well as the extensive influence of cognitive processes even at the level of the primary visual cortex. At the same time, there are many differences between these two groups of processes. First, as expected, top-down cognitive activities have to be voluntarily initiated. In other words, to a great degree, they rely on those structures of the prefrontal cortex that are involved in the functions of executive attention and verbal task setting (our tPFN and tFPNL). Neither of these anterior mechanisms is crucial in the viewing tasks with their overwhelming dependence on the posterior cortical areas and pathways.
Second, perhaps the most important result is the differential involvement of the centers and periphery of the visual cortical areas (i.e., two our visual networks, tCVN and tPVN) in the top-down cognitive activities of imagination and imagerybased remembering. In view of its significance, one should ask whether this is a genuine difference or rather an artifact of the specific baseline selection. In fact, we used fixation of a cross as the baseline in some of the tasks. In the retinotopic coordinates of the primary visual cortex, this would lead to an enhanced activation, which when subtracted can cause signs of inhibition in the central parts of these areas. A counterargument can be found in the data from our task conditions 6 and 7. Despite an extended stimulation in baseline, one can still see here top-down activation in the periphery but not centers of visual areas (Figure 1, tasks 6 and 7). From the theoretical point of view, this new dissociation continues a long list of differences in functioning of the periphery and centers of the visual system. This list starts with the differential distribution of retinal cone and rod cells, the latter being receptors of twilight vision with its higher light sensitivity and lower spatial resolution. This dichotomy persists into the distinctions of parvocellular and magnocellular pathways and, on a large-scale level, the distinction between ventral and dorsal “streams” of visual processing (Breitmeyer, 2014). There are also reports of a different connection of the peripheral and central parts of the visual cortical areas to specialized modules of building versus face recognition within the ventral visual pathway (Levy, Hasson, Harel, & Malach, 2004).
Thus, the existence of tPVN, a visual brain structure that participates in both stimulus-driven and cognitive processing, seems to be an established empirical fact. This explains the particular susceptibility of peripheral and twilight vision to cognitive top-down influences, which, on the one hand, mediate the visual search processes, but on the other hand, can result in a higher rate of false-alarm detections. The functional dissociation of tCVN and tPVN may also explain the phenomenology of mental imagery, including its low spatial resolution. More generally, this study reveals a new example of the structural and functional organization of brain networks based on various forms of symmetry and center-periphery relationships and associated with parameters of internal and external stimulation (Wedeen, Rosene, Wang, Dai, Mortazavi, Hagmann, Kaas, & Tseng, 2012).
Several identified task networks demonstrate sensitivity to the topic of scenarios. Unfortunately, the difference is contaminated by the correlation of content features, such as familiar versus novel and neutral versus dynamic and emotionally laden. As a rule, in viewing tasks, the “jump” scenario leads to a stronger activation than “lecture”. The loci of this activation are tCVN (perhaps due to intensive visual motion) and two other networks, tCTN and tFPNR. These primarily non-visual networks include elements of the MNS (Molnar-Szakacs & Uddin, 2013; Rizzolatti, 2005), which confirm the somatosensory engagement of our subjects while viewing “jump”. The only exclusion from the rule of “jump” predominance in viewing is tPVN. One possible explanation may be that a higher familiarity of “lecture” can lead to changes in activation down to the primary visual cortex in perception and recognition. There are a number of related suggestions in the literature (Pratte, & Tong, 2014; Sneve, Alnaes, Endestad, Greenlee, & Magnussen, 2012). We emphasize here the role of the visual periphery in functioning as a memory buffer. The familiar “lecture” scenario also prevails in most of the imagination conditions whereby again tPVN contributes to the effect. The activation of tFPNL, which implements verbal task setting mechanisms, also contributes to the prevalence of “lecture” imagination/ remembering. In contrast, tPFN seems to be a supramodal executive that ignores differences between the scenarios.
All networks identified in our study are basically the same RSNs, which fluctuate in a state of wakefulness. When performing a task, these networks combine or in some cases change their configuration. In our experimental conditions, the fronto-parietal and visual networks provide good examples of these changes. Furthermore, other researchers have also found stronger links within the networks at rest and the increase of interconnection power in task conditions (Bray, Arnold, Levy, & Iaria, 2014; Goparaju, Rana, Calabro, & Vaina, 2014). When interconnected, these networks subserve many creative and uniquely human abilities. Imagination is the crucial metaoperation for these abilities, and its influence on the structure and dynamics of brain activity is immense. However, this influence is also limited for the sake of accuracy in perceiving the real world.
Acknowledgments
This work was supported by the Russian Foundation of Basic Research (methodology of large-scale networks separation, Grants no. 13-04-01835,13-04-02036) and by a grant from the Russian Science Foundation (brains mechanisms of voluntary control in imagination and perception, Grant no. 14-28-00234 to the NRC “Kurchatov Institute”).
References
Balan, R. (2007). Estimator for number of sources using Minimum Description Length Criterionfor blind sparse source mixtures. Independent Component Analysis and Signal Separation. Lecture Notes in Computer Science, 4666, 333-340. doi: 10.1007/978-3-540-74494-8_42
Barkhof, E, Haller, S., & Rombouts, S. A. (2014). Resting-state functional MR imaging: A new window to the brain. Radiology, 271, 29-49. doi: 10.1148/radiol. 14132388 Bell, A. J., & Sejnowski, T. J. (1995). An information-maximization approach to blind separation and blind deconvolution. Neural Computation, 7(6), 1129-1159. doi: 10.1162/ песо.1995.7.6.1129
Botzung, A., LaBar, K. S., Kragel, R, Miles A., & Rubin D. C. (2010). Component neural systems for the creation of emotional memories during free viewing of a complex, real-world event. Frontiers in Human Neuroscience, 4(34), 1-10.
Bray, S., Arnold, A. E., Levy, R. M., & Iaria, G. (2014) Spatial and temporal functional connectivity changes between resting and attentive states. Human Brain Mapping. [Epub ahead of print], doi: 10.1002/hbm.22646
Breitmeyer, B. G. (2014). Contributions of magnoand parvocellular channels to conscious and non-conscious vision. Philosophical Transactions of the Royal Society, B, 369:20130213. doi: 10.1098/rstb.2013.0213
Calhoun, V. D., Adali, X, Pearlson, G. D., & Pekar, J. J. (2001). Spatial and temporal independent component analysis of functional MRI data containing a pair of task related waveforms. Human Brain Mapping, 13(1), 43-53. doi: 10.1002/hbm.l024
Cichy, R. M., Heinzle, J., & Haynes, J. D. (2012). Imagery and perception share cortical representations of content and location. Cerebral Cortex, 22(2), 372-380. doi: 10.1093/cercor/ bhrl06
Corbetta, M., Patel, G., & Shulman, G. L. (2008). The reorienting system of the human brain: From environment to theory of mind. Neuron, 58(3), 306-324. doi: 10.1016/j.neuron.2008.04.017
Goparaju, B., Rana, K. D., Calabro, F .J.,& Vaina, L. M. (2014). A computational study of wholebrain connectivity in resting state and task fMRI. Medical Science Monitoring, 20, 10241042. doi: 10.12659/MSM.891142
Jann, K., Kottlow, M., Dierks, X, Boesch, C., & Koenig, X (2010). Topographic Electrophysiological Signatures of fMRI Resting State Networks. PLoS ONE, 5(9), 1-10. doi: 10.1371/ journal.pone.0012945
Klein, I., Dubois, J., Mangin, J., Kherif, E, Flandin, G., Poline, J., Denis, M., Kosslyn, S. M., & Le Bihan, D. (2004). Retinotopic organization of visual mental images as revealed by functional magnetic resonance imaging. Cognitive Brain Research, 22, 26-31. doi: 10.1016/j. cogbrainres.2004.07.006
Levy, I., Hasson, U., Harel, M., & Malach,R. (2004). Functional analysis of the periphery effect in human building related areas. Human Brain Mapping, 22(1), 15-26. doi: 10.1002/ hbm.20010
Li, Y.-O., Adah, X, & Calhoun, V. D. (2007). Estimating the number of independent components for functional magnetic resonance imaging data. Human Brain Mapping, 28(11), 1251-1266. doi: 10.1002/hbm.20359
Molnar-Szakacs, I., & Uddin, L. Q. (2013). Self-processing and the default mode network: Interactions with the mirror neuron system. Frontiers Human Neuroscience, 7(571), 1-11.
Petersen, S. E, & Posner, M. I. (2012). The attention system of the human brain: 20 years after. Annual Review Neuroscience, 35,73-89. doi: 10.1146/annurev-neuro-062111-150525
Pratte, M. S., & Tong, F. (2014). Spatial specificity of working memory representations in the early visual cortex. Journal of Vision, 14(3), 22. doi: 10.1167/14.3.22
Rizzolatti, G. (2005). The mirror neuron system and its function in humans. Anatomy and Embryology, 210, 419-421. doi: 10.1007/s00429-005-0039-z
Smith, S. M., Vidaurre, D., Beckmann, С. E, Glasser, M. E, Jenkinson, M., Miller, K. L., Nichols, X E., Robinson, E. C., Salimi-Khorshidi, G., Woolrich, M. W., Barch, D. M., Ugurbil, K., & Van Essen D. C. (2013). Functional connectomics from resting-state fMRI. Trends in Cognitive Sciences, 17(12), 666-682. doi: 10.1016/j.tics.2013.09.016 Sneve,
M. H., Alnaes, D., Endestad, T., Greenlee, M.W., & Magnussen, S. (2012). Visual shortterm memory: Activity supporting encoding and maintenance in retinotopic visual cortex. Neuroimage, 63(1), 166-178. doi: 10.1016/j.neuroimage.2012.06.053
Stuss, D. T. (2011). Functions of the frontal lobes: Relation to executive functions. Journal of the International Neuropsychological Society, 17,759-765. doi: 10.1017/S1355617711000695
Tzourio-Mazoyer, N., Landeau B., Papathanassiou D., Crivello E, Etard, O., & Delcroix, N. (2002). Automated anatomical labeling of activations in spm using a macroscopic anatomical parcellation of the MNI MRI single subject brain. Neuroimage,15(1), 273-289. doi: 10.1006/nimg.2001.0978
Van der Stigchel, S., Belopolsky, A. V, Peters, J. C., Wijnen, J. G., Meeter, M., & Theeuwes, J. (2009). The limits of top-down control of visual attention. Acta Psychologica, 132,201-212. doi: 10.1016/j.actpsy.2009.07.001
Van Essen, D. C. (2012). Cortical cartography and Caret software. Neuroimage, 63(2), 757-764. doi: 10.1016/j.neuroimage.2011.10.077
Velichkovsky, В. M. (2006). Kognitivnaja nauka: Osnovy psihologii poznanija [Cognitive science: Foundations of epistemic psychology]. Moscow: Academia.
Wedeen, V. J., Rosene, D. L., Wang, R., Dai, G., Mortazavi, E, Hagmann, P., Kaas, J. H., & Tseng, W. I. (2012). The geometric structure of the brain fiber pathways. Science, 335(6076), 16281634. doi: 10.1126/science.l215280
To cite this article: Verkhlyutov V.M., Ushakov V.L., Sokolov P.A., Velichkovsky B.M. (2014) Large-scale network analysis of imagination reveals extended but limited top-down components in human visual cognition. Psychology in Russia: State of the Art, 7(4), 4-19.
The journal content is licensed with CC BY-NC “Attribution-NonCommercial” Creative Commons license.


