The Psychophysiological Diagnostics of the Functional State of the Athlete. Preliminary Data
Zakharov, I.M.  Ural Federal University named after the first President of Russia B.N.Yeltsin, Ekaterinburg, Russia
Abstract
The original experimental scheme was developed to investigate athletes’ functional states (FS) dynamics. The procedure allowed modeling various FS important for predicting the professional success of athletes: psychological and physiological stress, fatigue, and optimal FS (OFS). There were two main criteria for differentiation of the FS under study: efficiency rates and the psychological and physiological costs of the achieved efficiency level. Analysis of the FS-dependent psychophysiological changes showed significant interindividual differences on a number of parameters. Thus, no single indicator could be used as effective diagnostics for the FS criteria. A minimum number of indicators need to be recorded included cardiovascular indicators (heart rate, ECG), respiration, muscle tension (EMG), and brain activity (EEG) in the range of alpha and beta waves. The main problem can be artifacts induced by movement and muscle tension. The special procedure for artifact rejection and reduction of the artifacts was developed. It allowed recording EEG, ECG, and EOG signals simultaneously. Another problem was related to the development of the mathematical algorithm to analyze individual data and differentiate patterns of the signals recorded from the athletes. An original approach to differentiate the FS – the k-means clustering algorithm – was offered based on seven psychophysiological indicators. Results of clustering showed that the k- means algorithm for seven-component vectors allows one with confidence to differentiate state of quiet wakefulness, states of psychological and physiological stress. As the number of parameters used is attenuated from seven to four (without the EEG parameters) the accuracy of distinguishing FS is significantly reduced. To construct a complete and accurate differentiation of an athlete’s FS one should collect some statistical data on the dynamics of each FS in different time periods of the person’s life – in the process of training, after successful competition, and after losing competition.
Themes: Psychophysiology
PDF: http://psychologyinrussia.com/volumes/pdf/2012/isaychev.pdf
Pages: 244-268
DOI: 10.11621/pir.2012.0015
Keywords: sportsperson, functional state, psychophysiological indicators, integral evaluation.
The theme of this article, the diagnostics and evaluation of the optimal functional state of the sportsperson (OFSS), is widely discussed in modern sport psychology. These diagnostics are conducted during training and during competitions as well. The monitoring of OFSS dynamics provides an opportunity to determine a sportsperson’s deviation from the optimum realization of his or her capacities and to predict the reduction of a person’s sport efficiency.
The OFSS concept includes not only the physical or physiological perfect state but also the optimal combination and development of the professionally important psychophysiological and psychological qualities needed for specific sports. In European-American sport psychology the OFSS is called peak performance. This term is close in meaning to the OFSS, but it puts more emphasis on the relationship of the emotional sphere, a sportsperson’s stress resistance, and his/her professional efficiency. Intensive investigation of this problem started with the works of Yerkes and Dodson (1908), and it continues in modern sport psychology. Yerkes and Dodson laid down the main principle of the relationship of efficiency and stress level. Attempts to describe this dependence formally and to explain it meaningfully have led to a number of theories such as Hull’s drives theory (1943), the multidimensional theory of anxiety (Martens, Burton, Vealey, Bump, & Smith, 1990), the theory of catastrophe (Jonse & Hardy, 1990), the reversal theory (Kerr, 1997), the theory of critical moments (Carlstedt, 2004; Chadwick, 2005; Couture, 2007).
In this domain theoretical and practical approaches to the qualitative description and quantitative evaluation of the OFSS are being actively elaborated. Theories of the individual zone of optimal functioning and individual affect-related performance zones (Gould & Tuffy, 1996; Hanin, 2000a, 2000b; Hanin & Stambulova, 2002) have been stated and accepted. A number of possible diagnostics have been offered (Carlstedt, 2004, 2007, 2009; Johnson, Edmonds, Moraes, Filho, & Tenenbaum, 2007; Johnson, Tenenbaum, Edmonds, & Kamata, 2007; Kamata, Tenenbaum, & Hanin, 2002).
In Russian psychology the Functional State (FS) has a broader meaning than does peak performance. It denotes a complex of the psychophysiological functions, psychological characteristics, and qualities that are crucial for efficiency in any type of activity. FS dynamics are determined by a number of external and inner factors. There are different types of factors such as physical or social factors, individual factors, and factors connected with the specific activity (Egorov & Zagryadskiy, 1973; Il’in, 2005; Leonova, 1981; Leonova & Medvedev, 1981).
The neurophysiological mechanism of FS regulation consists of the complex modulation brain system including numerous activating and inactivating structures localized on the various levels of the brain stem and in the frontal areas of the limbic system. The major impact is found in the ascending activating systems of the reticular formation of the mesencephalon and preoptic nuclei of the telencephalon and in the inhibitory or suppressing systems of the nonspecific thalamic nuclei, lower domains of the pons, and myelencephalon. The modulation system is connected with the functional systems regulating activation processes for various types of activities (Danilova, 1992, 2000; Zenkov & Ronkin, 2004).
From the system psychophysiology point of view (Anokhin, 1978; Shvyrkov, 2006; Sudakov, 2000) the FS of the sportsperson can be seen as the qualitatively unique total response of the organism’s functional systems to external and internal influences appearing during a significant performance. The OFSS is one possible FS; it is characterized by maximum efficiency and productivity. Changes in the various psychophysiological systems involved unequally in different sports reflect and manifest as the specific biochemical, physiological, behavioral, and psychological patterns of the individual. Thus, the OFSS is a total state encompassing variations in different subsystems’ work, and this combination allows the sportsperson to achieve maximum efficiency in a given physical and social environment.
For control and estimation purposes, FS objective and subjective indicators are used. Objective indicators are various physiological measurements: electrocardiography (ECG), blood pressure, electroencephalography (EEG), event-related potentials, galvanic-skin reaction (GSR), eye activity, respiration, plethysmography, blood cortisol level, behavioral videomonitoring, communication frequency, and the results of the activity (speed and tempo of execution, number and character of mistakes) (Alexandrov, 2001; Danilova, 1992, 2000; Zenkov & Ronkin, 2004; Zinchenko & Tonevitskii, 2011). Subjective FS indicators include various tests, self-reports, psychological-tension questionnaires (Gogunov & Martianov, 2000; Marishchuk, Bludov, Plakhtienko, & Serova, 1984, 2005; Rodionov, 2010).
Nowadays in the majority of studies assessment of the FS of the sportsperson is based on subjective criteria such as tests and questionnaires conducted before a competition or after it. In a number of studies FS assessment involves particular morphological, physiological, and psychophysiological efficiency indicators (Bleer, 2008; Rodionov, 2010; Zinchenko & Tonevitskii, 2011).
Considering the difficulties of any sport (which requires the maximum mobilization of human physical and psychological resources), it is obvious that an integrated approach to OFSS assessment and description is needed. Multidimensional criteria for qualitative and quantitative FS assessment are presented in the Athlete’s Profile, which is based on the “theory of critical moments” (Carlstedt, 2004, 2007, 2009; Chadwick, 2005). The Athlete’s Profile includes the pattern of individual neurodynamic indicators, behavioral characteristics, and a number of psychophysiological indicators, including EEG, heart-rate variability, muscle tension.
A structurally but not ideologically close approach to OFSS assessment is used by the Moscow State University (MSU) psychology faculty; it involves developing innovative psychological and psychophysiological techniques for the professional training of athletes. In contrast to Carlstedt’s Athlete’s Profile, which contains a number of separate and sometimes unrelated characteristics, our approach is focused on the integrated assessment of athletes. Such assessment not only states the qualitative or quantitative characteristics of FS indicators at different levels and in various conditions but also includes all the psychological, psychophysiological, and physiological dynamics.
Mathematically, integrated assessment can be presented as a single vector with three blocks of elements, reflecting psychological, psychophysiological, and physiological indicators. Concrete indicators are chosen depending on the specifics of the sport and its professionally important qualities. According to expectations, integrated assessment will help not only in OFSS detection and its differentiation from nonoptimal FS (NFS) but in developing new training systems. There are a number of premises for this approach:
- It brings to awareness professionally important qualities and provides quantitative and qualitative estimations.
- It allows comparison of a given level of professionally important qualities with the level required for competition.
- It takes into consideration the level of athletes’ individual physiological, psychophysiological, psychological, and behavioral characteristics.
- It allows the accurate assessment of FSs according to total measurements and predicts dynamics depending on the training system and current significant events in the athlete’s life.
The elaboration of an integrated assessment included a number of sequential stages dedicated to local and global methodological problems. In the first stage it was important to elicit interrelated parameters that reflect various aspects of psychological and psychophysiological organization and characterize dynamic changes of FS during professional activity. In this stage the main goal is an analysis of individual and group variability in the FS indicators and their significance to present FS diagnostics. To solve this problem we developed an experimental scheme modeling various FSs: rest, optimal performance, psychological stress state, physiological stress state.
In the second stage the obtained indicators were preliminarily handled with mathematical methods (mathematical analysis, classification). This stage was dedicated to developing an educable algorithm of diagnostics and differentiating FSs.
Integrated Investigation of the OFSS Procedure
During the experiment we had to obtain psychological, psychophysiological, and physiological data reflecting the subjects’ characteristics in various FSs. Psychological data were based on the test battery (brief description see below). Various FSs were modeled with the STARS technique developed by the MSU psychology faculty, and physical activity was measured by a stationary-bicycle ergometer.
FS Modeling
In order to induce various FSs, the STARS computer program was devised. Its stimuli-presenting paradigm was based on signal-detection theory, a threshold theory that explains sensory-perception processes as the interaction of two variables: the sensory process itself and decision making. According to this theory signal perception starts with the neuronal excitation phase, and perceptual decision making depends on detecting the signal. A decision is affected by the subject’s experience, personality, and motivational factors, and on the specificity of the task (Zabrodin, 1976).
This software provided many options for object presentation. It allowed the creation of tasks of various difficulty and the modeling of various FSs (rest, optimal performance, stress). It also let us assess performance results in each experimental series. The main efficiency indicators were correct signal-detection and false-alarm probability. Data were displayed on a diagram as dots moving on the coordinate plane in respect to target zones (zones where subjects’ mistake rates must not exceed the limit). In such conditions task-performance dynamics could be monitored step by step (from iteration to iteration) and compared with physiological-indicator dynamics.
Subjects performed four tasks using STARS software:
- training for target-stimuli detection;
- setting test levels (to determine the optimal level of target-stimuli detection);
- maintaining working-zone level – for example, maintaining the performance level attained on the previous test;
- performing under stress-provoking (NFS) conditions (to assess sensitivity to psychological stress factors).
The following specific tasks were presented. The subject was given sets of dynamically changing objects – “stars” of different shapes and in different relief planes flying toward the subject. Objects were divided into background, masking (false), and target. Each single experimental procedure was called a test. Every test was divided into different tasks. Tasks included a number of stimuli sequences: iterations consisted of 15 screen presentations with the target stimuli or without it. The transition from one iteration to another was uninterrupted. Every task had for each subject an attributed target zone – the ratio of correct answers to false alarms. If the subject succeeded in maintaining the ratio, the task was considered passed.
Before the testing, target-zone setting was carried out in order to unify settings for all the subjects. Zones were represented as the P(Y/S) – P(Y/N) coordinate system, where P(Y/S) was the correct-answers probability and P(Y/N) was the false-alarm probability.
STARS software provided feedback loops. The program controlled performance results and chose actions (changing the difficulty rate, presenting texts or sounds) according to the results and set conditions. Subjects were also given auditory feedback: certain sounds represented correct or false answers. After every target stimuli, the subject had to push a button. Target stimuli appeared in any part of the screen with a given probability of 0.6.
Detecting signals was complicated by the presentation of masking (false) objects. They appeared with a probability of 0.73. If the subject pushed the button when masking objects were presented (false alarm), a noise was used as a feedback.
The software maintained target-stimuli “fly” (presenting time) on the same level independently of initial location. Thus, closer to the edge of the screen the target stimuli were presented more slowly as they moved against other objects (moving with the same speed everywhere).
In our experimental procedure the target stimuli were red stars with eight beams. Masking objects were similar red stars but with four beams. Background stimuli were presented as the starry sky with roundish white stars. Several thousand of them were randomly distributed on the screen.
Performance results were presented as four types of probabilities:
- correct target-stimuli detection
- correct stimuli neglecting, masking-stimuli miss
- false alarms
- target-stimuli miss
Every probability type was calculated based on the quantity of objects presented. Next, “payoff matrices” were compiled according to the response: 10 points for correct stimuli detection and correct maskingobject misses, and minus 10 points for false alarms and target misses. Matrices were symmetric for all the responses and were not changed during the experimental procedure.
To devise the FS categorization program we focused on the psychological criteria for the activity performance. We suggested that if the subject succeeded in performing the individually selected test, the FS was regarded as optimal. If the subject had reached a certain performing level and after that started to make mistakes because of external or inner factors and reduced efficiency, then the FS was regarded as nonoptimal. NFS, depending on its nature, can be represented by various states. Some of them can have qualitative and meaningful value (for example “monotony,” “boredom,” “fatigue,” “hyperactivity,” “stress,” “affect”), and others can be differentiated only quantitatively. Thus, depending on the test results, all observed states can be regarded as optimal and nonoptimal with significant quantitative differences.
For every FS scheme, a specific test was devised. The first test was training. The subject learned to distinguish target stimuli from the background. Learning was determined by the subject's getting into the target zone. Every correct answer gave the subject 10 points, and for every false answer 10 points were subtracted. The total points were displayed on the bottom of the screen. Transition to the next stage was possible only with a total of not less than 90 points.
After managing the training task the subject switched to the next test, the difficulty of which became greater with each iteration. Complication was achieved by progressive changing of the target stimuli shape and color (from bright red to pale pink, getting closer to the background color), increasing masking, and increasing the number of “wandering” background objects. Complication increased until the subject got to the “mistaking” zone (e.g., got out of the target zone).
After that the subject had to maintain the target zone for several minutes. Thus, the test was tuned to the specificity of the subject's perception, and the optimal difficulty corridor was determined. After successful maintenance the subject switched to the next stage–stress-tension modeling. The task during this stress-provoking test was the same, but if subjects failed to maintain their performance level of the previous stage they would be punished with a slight but unpleasant electric shock of 5 mA. In addition, during this stage auditory feedback was increasingly frustrating (screams, sounds of broken glass, mockery).
For the first three tasks, if the subject got into the target zone and managed to stay there for a certain period of time, the test would beregarded successful and the FS would be regarded optimal. If the subject didn't manage to get to the target zone or stay there for enough time, the FS would be regarded nonoptimal.
The fourth, “provoking,” test was related to the assessment of psychological stress factors. This task had to promote a reduced performance level and lead to NFS. To obtain a rise in psychoemotional tension, aversive stimulation (a slight but unpleasant electric shock) was used for the unsuccessful performance of the task. During the provoking test, an electric shock was presented with 0.5 probability; during the time required to get to and stay within the target zone, the probability was 0.2. The NFS was defined by using additional psychological testing, a post-test interview, and electrophysiological data analysis.
The software also provided a chance to analyze subjects' response times.
Experimental Procedure
Various FS-modeling STARS tests were conducted in a special noiseisolated room. The subject sat in a chair looking at a screen for which the sight line was 80 cm. The chair’s position was varied for each subject. In their right hands subjects had a computer mouse; their left hands were free. Auditory stimulation was presented through headphones. The screen image was copied to the experimenter’s computer for monitoring activity. A typical view of the experimental setting is presented on Figure 1.
After the STARS test the subjects went through bicycle ergometer training at a medium level of physical stress. The bicycle ergometer test characteristics were determined individually depending on the subject’s age and weight. Subjects were able to stop the test if they became tired, but none of the subjects asked to do so.
The bicycle ergometer test procedure consisted of pedals turning continuously at a given speed for 5 minutes. The speed and intensity were shown on the screen. The subjects had to maintain speed in the medium area according to the indicator on the screen. Then the ergometer’s program increased the strain stepwise from 90 to 190 watts in equal intervals. In parallel the EEG, ECG, electrooculography (EOG), plethysmography (PPG), electromyography (EMG), and recursiverespiration signals were recorded. After the procedure, the rest EEG signal was recorded. We used Medicom-Mtd equipment for recording. A typical view of the bicycle ergometer test can be seen in Figure 2.
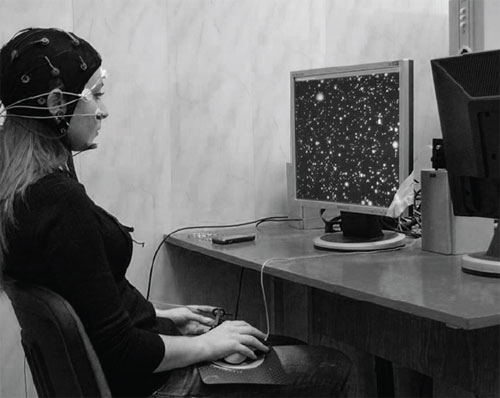
Figure 1. Typical view of the experimental setting for the STARS test
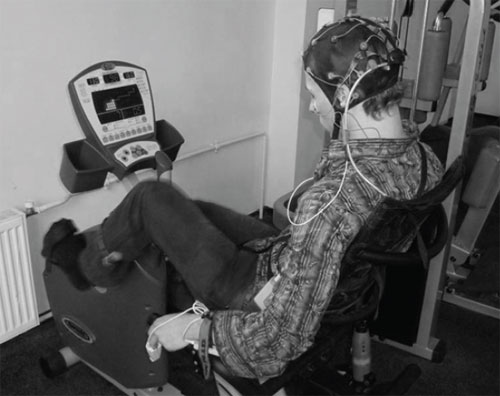
Figure 2. Typical view of the bicycle ergometer test
Psychophysiological Data Recording and Primary Handling
EEG recording was carried out with the Medicom-Mtd Encephalan 131-03 equipment and software. We recorded signals from 17 sites: F3, F4, F7, F8, Fz, Fpz, C3, C4, Cz, T3, T4, P3, P4, Pz, O1, O2, Oz for the standard 10–20 system. The derivation scheme was base monopolar. Referent electrodes were based on the ear lobes. The discrimination frequency was 250 Hz, the low-frequency filter (LFF), 70 Hz; the high-frequency filter (HFF), 0.16 Hz; the contamination signals rejection, 50 Hz. Electrode resistance did not exceed 15 Khoum. The EOG signal was recorded with miniature self-adhesive electrodes placed for the vertical EOG 1 cm under and below the right eye; for the horizontal EOG, 1 cm from the corners of the eyes on the right and left temple level. The LFF was 15Гц; the HFF, 0.16Гц. The ECG signal was recorded from two electrodes on the subject's forearms. An additional ground electrode was placed on the left forearm. The LFF was 30 Hz; the HFF, 0.5 Hz. The respiration signal was recorded with the encircling sensor fixed under the diaphragm. The LFF was 5 Hz; the HFF, 0.016 Hz. We also recorded PPG and GSR signals on two additional channels. The PPG sensor was placed on the subject's left-hand middle finger. GSR electrodes were placed on the subject's lefthand forefinger and ring finger. For the PPG, the LFF was 15 Hz; the HFF, 0.5 Hz. For the GSR, the LFF was 5 Hz; the HFF, 0.05 Hz.
After electrophysiological data recording, primary handling was started. In every recording, automatic artifacts that reduced the system were used, taking into account the two EOG signals. Minimal signal amplitude for both channels was 80 uV (with a corridor of 2 standard deviations). These manipulations let us reduce the influence of EEG eye-movement artifacts. All the data were also manually handled in order to reject remaining eye-movement and head- and hands-movement artifacts.
Subjects
The experimental procedure included a number of series with different numbers and backgrounds for the subject groups. For the first, pilot, series there were 10 subjects. All participants were students of psychological faculty of MSU. The goal of this series was to work out the STARS testing and psychophysiological data recording. All the subjects participated voluntarily. They also signed an agreement for participation in the experiment with the slight electric shock (for stress-tension modeling). In the second, main, experimental series 13 subjects, professional Greek- Roman wrestlers, participated (the average age was 21 years).
Results
One of the main goals of the research was elaboration of the experimental procedure to allow for various kinds of FS modeling. From the point of view of training professional athletes, the most interesting are strong psychological and physiological stress states, minimal fatigue, and OFSS–that is, the most adequate states for a specific performance.
Two indicator types could be possible criteria for these states: (1) the efficiency rate, (2) the level of psychological and physiological resource application.
These indicators allow experiments not only to control the efficiency of modeled activities but also to assess their psychophysiological costs.
STARS software allowed us to model three states: (1) rest FS: this was the training stage; the subject learned the task, all the tasks were easy; (2) optimal FS (OFS): the subject had to get to a certain state and manage to maintain it with specific efforts; (3) stress FS: this was a stress test with the possibility of electric shock; the subject had to perform the task in psychologically adverse conditions.
Histograms 1–3 show individual and group efficiency changes on the STARS target-stimuli-detection task. Histogram 1 data prove that detection probability is highest in the OFS; next, in the rest FS; and least probable in the stress FS. The probability of false alarms has an inverted ratio: the highest rates are in the stress state; the least, in the OFS. The observed relationship of the FS dynamics and efficiency rates proves that the chances of FS modeling change with the conditions under which the task is performed.
This tendency is preserved on the individual level. In Histogram 2 individual signal-detection probabilities in various FSs can be seen. In 50% of the cases the task was most efficiently performed in the OFS, and the highest false-alarm rate in 60% of the cases was in the stress FS. Individual efficiency changes show some individual differences in task performance; these differences reflect subjects’ psychophysiological characteristics. For example, subject 1 had nearly equal efficiency in all three states, and subject 4 had more mistakes in the stress state than any other subject and thus had the lowest stress resistance.
Histogram 1.
Group differences in the effectiveness of execution of a task by a subject in the control group under different FSs. Along axis X are designations of different FSs under different loads. Along axis Y are the values of the probability of correct target-stimuli detection (CD) and the probability of false alarms (FA)
Histogram 2.
Individual differences in the effectiveness of task execution in diff e rent FSs: control group. Along axis X are individual values for every subject in different FSs. Along axis Y are the values of the probability of correct signal detection
Individual changes in the false-alarm probability (Histogram 3) show higher dispersion than in the correct-detection probability (Histogram 2). In this case, in the stress FS for the majority of the subjects (60%) the false-alarm probability rate increased, and in 70% this probability was reduced in the OFS.
Histogram 3.
Individual differences in the effectiveness of task execution in different FSs: control group. Along axis X are individual values for every subject in different FSs. Along axis Y are the values of the probability of a false alarm
Analysis of individual and group performance data allows us to reach the preliminary conclusion that our method can be efficient for FS modeling.
Individual and Group STARS Test Performance
Efficiency in the Experimental Group
Pilot research results with the control group proved the experimental scheme to be adequate for rest, optimal, and stress FS modeling. Th e same scheme was used in the research with the wrestler group. Our pilot results showed that OFS is nonhomogenous for the majority of the subjects.
For more delicate FS diff erentiation we divided OFS into two time periods or phases. OFS1 occurs when the subject has just gotten into the target zone, the easier task; and OFS2 occurs in the maintenance phase, when the subject has to keep the mistake rate at a constant level, the more diffi cult task. Data were acquired from every STARS test stage.
Histogram 4 shows overall data for the experimental group. Th e tendency is that as task diffi culty increases, the probability of correct signal detection is reduced and the probability of false alarms increases. Th e most crucial reduction in performance effi ciency is observed in the stress state. It is more pronounced in the control group (see Histogram 1). Athletes in the stress state show lower signal-detection and higher falsealarm probability. Th e data presented prove that both parameters can be used for quantitative assessment of the FS of interest.
Histogram 4.
Group diff erences in the eff ectiveness of task execution in diff erent FSs: experimental group. Along axis X are diff erent FSs under diff erent loads. Along axis Yare the values of the probability of correct target-stimuli detection (CD) and the probability of false alarms (FA).
For data-signifi cance estimation we used the χ2 Friedman test criterion for two independent samples. Th is test can be described as a nonparametrical analog of the repetitive-measurement dispersion analysis. Th e two data arrays were handled separately. Th e fi rst one included falsealarm- probability rates in four experimental stages: rest state, OFS1, OFS2, stress state. Th e second array included probability rates for correct target-stimuli detection in the same stages. Results given in Table 1 show signifi cant diff erences among the investigated FS indicators.
Table 1
Data-Signifi cance Estimation for False-Alarm and Correct-Detection Probabilities
Friedman test (false alarms) |
Mean rank |
Friedman test (correct detection) |
Mean rank |
Rest state FA |
1.77 |
Rest-state CD |
3.85 |
OFS1 FA |
2.23 |
OFS1 CD |
2.54 |
OFS2 FA |
2.50 |
OFS2 CD |
2.35 |
Stress state FA |
3.50 |
Stress-state CD |
1.27 |
|
|
|
|
N |
13 |
N |
13 |
chi-square |
15.244 |
chi-square |
27.861 |
df |
3 |
df |
3 |
Asymp. Sig. (p) |
< .002 |
Asymp. Sig. (p) |
< .000 |
Note. Mean rank is given separately for false-alarm (FA) and correct-detection (CD) groups. χ2 (chi-square) is the empirical criterion value; df is the degree of freedom; p is the signifi cance level.
Histogram 5.
Individual differences in the effectiveness of execution of the task in different FSs: experimental group. Along axis X are the individual values for every subject. Along axis Y are the values of the probability of correct detection of the signal
Correct-detection data analysis shows significant interindividual variability in task-performance efficiency, as can be seen in Histograms 5 and 6. The experimental group had generally better results than the control group. When the detecting signal showed maximum efficiency, 8 of the 13 people (62%) had no mistakes in the rest state, and 1 of them had no mistakes even in the stress state.
Histogram 6.
Individual differences in the effectiveness of the execution of the task by the subjects under different FSs: experimental group. Along axis X are the individual values for every subject. Along axis Y are the values of the probability of false alarms while detecting a signal
False-alarm variability analysis also shows that the experimental group tended to be more efficient than the control group. In the control group the best result–a false-alarm probability lower than 0.1–was observed for only 2 subjects (20%). In the experimental group 12 of the 13 subjects had this result, which indicates that in certain FSs nearly the whole group worked without mistakes.
Thus, analysis of individual and group STARS test performing efficiency for the control group and the experimental group showed that:
- the experimental scheme allowed the experimenter to model various FSs and to quantitatively assess each subject’s efficiency in an FS;
- adequate OFS, stress state, and rest state can be modeled for a specific person by changing the difficulty of the task;
- the experimental group, which consisted of athletes, performed better than the control group in the signal-detection task.
Psychophysiological Indicators of Group and Individual Dynamics in Various FSs
As was mentioned above, FS assessment includes not only efficiency rates but various psychophysiological indicators as well. They reflect the physiological cost of the efficiency achieved.
Traditionally for FS diagnostics electrophysiological indicators of vagus nerve stimulation and central nervous system functioning are used. Most common are EEG, ECG, EOG, GSR, EMG, and their derivatives. We had to choose the most adequate indicators for individual and group diagnostics and differentiation (Table 2).
Table 2
Objective (Psychophysiological) Indicators of the FS of Athletes
1 |
EOG blink |
Averaged value of winking / min |
2 |
ECG rate |
Frequency of cardiac beat |
3 |
RD rate |
Number of breathing cycles / min |
4 |
RD RQ |
Relative portion of inhalation in breathing cycle |
5 |
Alpha/beta |
Ratio of alpha rhythm to beta rhythm in EEG |
6 |
Alpha% |
Portion of the time when alpha rhythm dominates in EEG |
7 |
Beta% |
Portion of the time when beta rhythm dominates in EEG |
Selection of the indicators was based on a literature data review and our previous researches in this sphere. It is well known that the activity of athletes has a complicated organization. It includes a number of structures and mechanisms responsible for different stages of execution: information reception and processing, anticipation of results, decision making, and the realization of the activity type chosen. The complexity of sport activities is also determined by the number of the organism’s subsystems involved. Their combination and role in single stages of the activity are specific for each person. Thus, one or two indicators are not effective for the current description of FSs and, in addition, are inadequate for describing the total FS dynamics during activity analysis.
Preliminary indicator selection included mathematical individual and group data acquired in modeling FSs.
As we mentioned above, for the experimental group one testing procedure – bicycle ergometer exercises – was added in order to distinguish another FS, physical stress. Thus, for this group we investigated psychophysiological dynamics for five modeled FSs: rest state, OFS1, OFS2, psychological stress, physical stress.
We analyzed in detail individual and group differences discovered through the above-described psychophysiological indexes. We found that different FSs for every subject are characterized by a specific set of parameters. For example, the distribution of psychophysiological indicators shows that physical stress can be clearly distinguished from the other states. The most significant changes are related to the functioning of the cardiovascular system. However, a number of indicators are sensitive to psychological stress – for example, beta is higher for psychological stress than for the other states.
The predictive value of the presented data can be quite ambiguous. Some indicators show expected quantitative differences in the investigated FS – for example, EOG ACT, ECG DEV, and beta increase with stress tension. Other indicators have multidirectional changes. Individual rates in various FSs can change in opposite directions. The dispersion of some subjects' heart rates increases in the stress state; in other subjects it is sharply reduced. The dynamics of brain rhythms, respiration, eye movement also have individual specificity in various FSs.
Data analysis of individual eye movement, heart rate variability, EEG data, and respiration showed significant differences in various states. These interindividual differences are most obvious in the physiological and psychological stress states.
Thus, our research results prove that there can be significant interindividual and intergroup differences in the psychophysiological indicators depending on the experienced FS. Therefore, none of the indicators taken separately can be used as a reliable criterion for identifying and differentiating FSs. So in the present research we focused on the mathematical algorithm; doing so allowed us to analyze individual data in order to distinguish unique patterns of athletes’ psychophysiological activity.
Design and Selection of Methods of Mathematical Processing and Analysis of Psychophysiological Data
Removing Artifacts
For the algorithm for determining the FS of an athlete to work with data recorded during the real-time performance of various tasks, it is necessary to ensure stable recording of psychophysiological indices with the fewest artifacts (damaged parts of records) or to develop a technology for the detection and automatic removal of artifacts. The EEG, ECG, and EOG parameters are most sensitive to motor artifacts. In order to correct the EEG, EOG, and ECG parameters, a method of identifying and removing artifacts was developed. This method analyses other fragments of records and determines whether artifacts are present in any of those fragments or not. Briefly, the essence of the method is as follows. For each signal the algorithm constructs a feature vector consisting of six elements: (1) average signal power in the range of 0.5–2 Hz, (2) average signal power in the range of 2.5 Hz, (3) average signal power in the range of 5–15 Hz, (4) average signal power in the range of 15–30 Hz, (5) signal amplitude, (6) variation of the signal. A method for constructing a feature vector uses a weighted Hamming window and a discrete Fourier transform. The components of the feature vector are compared with threshold values. If at least one of the first four components is greater than the corresponding threshold, a fragment of the signal is marked as containing artifacts. Thresholds are computed from training data. The data consist of 1-second snippets, in which fragments containing artifacts are marked by hand. Then, for each fragment, a feature vector is constructed.
Terms of recording signals can vary over time, so we apply the normalization of each feature vector. We assume that the artifacts are contained in fewer than half the signals. In this case, the median of the feature vectors’ components is a good estimate of the average values of the components in the absence of artifacts. After calculating the median, we normalize the feature vector. In the case of multichannel data, we mark a fragment as containing artifacts if the method detects artifacts in two or more channels. After this preprocessing and correction of artifact records, the parameters that were used for diagnostics and classification of different FSs are calculated with a specially designed algorithm.
Algorithm for Diagnostics and Differentiation of FSs on the Basis of the Complex of Psychophysiological Indicators
A wide range of individual differences on a large set of indicators makes impossible manual processing and data analysis for evaluation and differentiation of FSs. So one of the objectives of the study was to develop a self-learning mathematical algorithm (SLA) that allows us to automatically differentiate present FSs (states of psychological or physiological stress, the fatigue state, or the affective state) and to evaluate their closeness to an OFS. To develop an SLA we used data from a series of experiments with the modeling FSs of the wrestlers. Each FS was assessed according to productivity assignments and was characterized by a specific pattern of the selected physiological parameters. The SLA was constructed using the clustering method, which defined the rules for the classification of the FSs on the basis of calculated physiological parameters. For experimental analysis and testing of the developed SLA we used parameters of muscle activity and the autonomic nervous system (EOG blink, ECG rate, RD rate, RD RQ) and three parameters of EEG (alpha/ beta, alpha%, beta%). To monitor changes of a subject’s FS over time, the overall record, which ranged from 5 to 10 minutes for each simulated FS, was divided into 2-minute intervals with a 1-minute overlap. In each of these segments the vector of the parameters was calculated. Further, the vectors of parameters were normalized and clustered using the k-means algorithm. We used only the normalization of the mean value of the large number of peaks, which distort the variance. The clustering k-means algorithm performs the separation of N vectors into K clusters, where each vector corresponds to the cluster with the nearest mean. We used K = 5 clusters.
Results of clustering for all subjects of the control group during the simulation of a FS using the STARS program show that the k-means algorithm for seven-component vectors that contain all the above-mentioned parameters allow one with confidence to differentiate in 70% of subjects the following FSs: state of quiet wakefulness, states of psychological and physiological stress. As the number of parameters used is attenuated from seven to four (without the EEG parameters – alpha/beta, alpha%, beta%), the accuracy of distinguishing FSs is significantly reduced. Using four parameters of the muscles and activity of the autonomic nervous system allows distinguishing only dramatic changes in human FSs (for example, the state of physiological stress and the state of rest). Thus, by using a set of seven parameters we were able accurately to determine the FS in most observed cases.
It should be noted that our experimental results are restricted in two respects: (1) we didn’t take into account the individual characteristics of each athlete, and (2) the FSs were simulated in lab conditions but were not studied during real activity. To construct a complete and accurate differentiation of an athlete’s FSs one should collect some statistical data on the dynamics of each FS in different time periods of the person’s life – in the process of training, after successful competition, and after losing competition. This procedure would allow identifying some possible variations of each state, increasing the accuracy of assessing the quantitative differences between individual states, and dramatically improving the resolution of the proposed algorithm.
Conclusion
Our research leads to a number of conclusions regarding technologies for assessing the FSs of athletes.
We developed an experimental scheme to investigate athletes’ FS dynamics. This scheme allowed us to model various states important for predicting the professional success of athletes – for example, psychological and physiological stress, fatigue, and OFS. There were two main criteria for differentiation of the states: efficiency rates and the psychological and physiological cost of the achieved efficiency level.
Analysis of the FS-dependent psychophysiological changes showed significant interindividual differences on a number of parameters. Thus, no single indicator could be used as effective diagnostics for the FS criteria. A minimum number of indicators need to be recorded: cardiovascular indicators (heart rate, ECG), respiration, muscle tension (EMG), and brain activity in the range of alpha and beta waves. The main problem can be artifacts induced by movement and muscle tension. We developed a special procedure for artifact rejection and reduction. It allows us to record EEG, ECG, and EOG signals simultaneously.
Another problem is related to the development of the mathematical algorithm to analyze individual data and differentiate patterns of the signals recorded from the athletes. We offered a possible approach to its development. The k-means clustering algorithm is an example of FS differentiation based on seven psychophysiological indicators. Enhancing the algorithm’s resolution requires improved statistics for the FS of interest in various actual conditions.
Acknowledgments
The research was supported by the grant “Development of innovative methods for scientific, educational and practical activities of psychologist with application of virtual reality technologies” and the grant “Development of innovative technologies for psychological and psychophysiological supporting of professional sportsman” in the frame of the federal program “Scientific and scientific-pedagogical personnel of innovative Russia” for 2009–2013.
References
- Anokhin, P.K. (1978). Izbrannye trudy: Filosofskie aspekty teorii funktsional’nykh system [Selected works: Philosophical aspects of the theory of functional systems]. Moscow: Nauka.
- Alexandrov, Y.I. (Ed.). (2001). Psikhofiziologiya [Psychophysiology]. St. Petersburg: Piter.
- Bleer, A.N. (Ed.). (2008). Psikhologiya aktivnosti v ekstremal’nykh usloviyakh [The psychology of activity in extreme conditions]. Moscow: Akademiya.
- Carlstedt, R.A. (2004). Critical moments during competition: A mind-body model of sport performance when it counts the most. New York: Psychology Press.
- Carlstedt, R.A. (2007). Integrative evidence-based athlete assessment and intervention: A field-tested and validated protocol. Journal of the American Board of Sport Psychology, 1, 1-30.
- Carlstedt, R.A. (2009). Handbook of integrative clinical psychology, psychiatry, and behavioral medicine: Perspectives, practices, and research. New York: Springer.
- Chadwick, R. (2005). Critical moment performance and “Athlete’s Profile” assessment in high school soccer players: An investigation of the theory of critical moments. Technical report from the ABSP Certification final project. New York: American Board of Sport Psychology.
- Couture, J. (2007). Critical moment performance, “Athlete’s Profile” assessment and pre and post heart rate variability-performance relationships in college baseball players: An investigation of the theory of critical moments and Athlete’s Profile models. Technical report from the ABSP Certification final project. New York: American Board of Sport Psychology.
- Danilova, N.N. (1992). Psikhofiziologicheskaya diagnostika funktsional’nykh sostoyanii [Psychophysiological diagnostics of functional states]. Moscow: Moscow State University.
- Danilova, N.N. (2000). Psikhofiziologiya [Psychophysiology]. Moscow: Aspekt Press.
- Egorov, A.S., & Zagryadskiy, V.P. (1973). Psikhofiziologiya umstvennogo truda[Psychophysiology of mental activity]. Leningrad: Nauka.
- Gogunov, E.N., & Martianov, B.I. (2000). Psikhologiya fizicheskogo vospitaniya I sporta [The psychology of physical education and sport]. Moscow: Akademiya.
- Gould, D., & Tuffy, S. (1996). Zones of optimal functioning research: A review and critique. Anxiety, Stress, and Coping, 9, 53-68.
- Hanin, Y.L. (Ed.). (2000a). Emotions in sport. Champaign, IL: Human Kinetics.
- Hanin, Y.L. (2000b). Introduction: An individualized approach to emotion in sport. In Y.L. Hanin (Ed.), Emotions in sport (pp. ix-xii). Champaign, IL: Human Kinetics.
- Hanin, Y.L., & Stambulova, N.B. (2002). Metaphoric description of performance states: An application of the IZOF model. Sport Psychologist, 18, 396-415.
- Hull, C.L. (1943). Principles of behavior: An introduction to behavior theory. New York: Appleton-Century-Crofts.
- Il’in, E.P. (2005). Psikhofiziologiya sostoyanii cheloveka [The psychophysiology of human states]. St. Petersburg: Piter.
- Johnson, M.B., Edmonds, W.A., Moraes, L.C., Filho, E.S.M., & Tenenbaum, G. (2007). Linking affect and performance of an international level archer: Incorporating an idiosyncratic probabilistic method. Psychology of Sport and Exercise, 8, 317-335.
- Johnson, M. B., Tenenbaum, G., Edmonds, W. A., & Kamata, A. (2007). Individual affect-related performance zones (IAPZs) during tennis competition: A dynamic conceptualization and application. Journal of Clinical Sport Psychology, 1, 130-146.
- Jonse, J.G., & Hardy, L. (1990). A catastrophe model of performance in sport. In J.G. Jonse & L. Hardy (Eds.), Stress and performance in sport (pp. 81-106). Chichester, England: Wiley.
- Kamata, A., Tenenbaum, G., & Hanin, Y.L. (2002). Individual zone of optimal functioning (IZOF): A probabilistic estimation. Journal of Sport & Exercise Psychology, 24, 189-208.
- Kerr, J. H. (1997). Motivation and emotion in sport: Reversal theory. New York: Psychology Press.
- Leonova, A. B. (1981). Psikhodiagnostika funktsional’nykh sostoyanii cheloveka [The psychodiagnostics of human functional states]. Moscow: Moscow State University.
- Leonova, A.B., & Medvedev, V.I. (1981). Funktsional’nye sostoyaniya cheloveka v trudovoi deyatel’nosti [Functional states of humans in work activities]. Moscow: Moscow State University.
- Marishchuk, V.L., Bludov, Y.M., Plakhtienko, V.A., & Serova, L.K. (1984). Metodiki psikhodiagnostiki v sporte [Methods of psychodiagnostics in sport]. Moscow: Prosveshchenie.
- Marishchuk, V.L., Bludov, Y.M., Plakhtienko, V.A., & Serova, L.K. (2005). Psikhodiagnostikav sporte [Psychodiagnostics in sport]. Moscow: Prosveshchenie.
- Martens, R., Burton, D., Vealey, R.S., Bump, L., & Smith, D. (1990). The development of the Competitive State Anxiety Inventory-2 (CSAI-2). In R. Martens, R. S. Vealey, & D. Burton (Eds.), Competitive anxiety in sport (pp. 117-190). Champaign, IL: Human Kinetics.
- Rodionov, A.V. (2010). Psikhologiya fizicheskoi kul’tury i sporta [The psychology of physical culture and sport]. Moscow: Akademiya.
- Shvyrkov, V.B. (2006). Vvedenie v ob’ektivnuyu psikhologiyu: Neirinal’nye osnovy psikhiki. Izbrannye trudy [Introduction to objective psychology: Neuronal basics of the psyche. Selected works]. Moscow: IP RAN.
- Sudakov, K.V. (Ed.). (2000). Fiziologiya: Osnovy i funktsional’nye sistemy [Physiology: Basics and functional states]. Moscow: Medizina.
- Yerkes, R.M., & Dodson, J.D. (1908). The relation of strength of stimulus to rapidity of habit formation. Journal of Comparative Neurology of Psychology, 18, 459-482.
- Zabrodin, Y.M. (1976). Protsessy prinuatiya resheniya na sensorno-pertseptivnom urovne [Processes of making decisions at the sensoriperceptual level]. Moscow: Nauka.
- Zenkov, L.R., & Ronkin, M.A. (2004). Funktsional’naya diagnostika nervnykh boloeznei [Functional diagnostics of nerve diseases]. Moscow: MED press-imform.
- Zinchenko, Y.P., & Tonevitskii, A.G. (2011). Psikhologiya sporta [Sport psychology]. Moscow: Moscow State University.
To cite this article: Isaychev S.A., Chernorizov A.M., Korolev A.D., Isaychev E.S., Dubynin I.A., Zakharov I.M. (2012). The Psychophysiological Diagnostics of the Functional State of the Athlete. Preliminary Data. Psychology in Russia: State of the Art, 5, 244-268
The journal content is licensed with CC BY-NC “Attribution-NonCommercial” Creative Commons license.


